
Journal of Law, Information and Science

|
|
Home
| Databases
| WorldLII
| Search
| Feedback
Journal of Law, Information and Science |
|
NICHOLAS CALABRIA[*]
This paper provides an introduction to some of the features associated with Computer Based Mapping using existing GIS and available technology. It presents some of the concepts central to understanding how a GIS (Genamap) operates and the difficulties and limitations of legal practitioners being involved with the available technology. The paper also considers possible uses for a GIS in legal practice including those relevant to various aspects of native title and land claims.
This paper introduces the concept of a GIS (Geographic Information System). It refers to the GIS "ARC/INFO" (and associated product "Arc View") but the main focus is upon the GIS "Genamap". It considers possible uses for a GIS in legal practice including applications relevant to various aspects of native title and land claims. Various terms and concepts are considered and defined before setting out the practicalities, including limitations, of using a GIS. Finally, questions are raised and some suggestions are put forward.
1 To introduce “Genamap” and “ARC/INFO” as examples of Geographic Information Systems (GIS);
2 To show the relevance of Computer Mapping to legal practice in general and native title and land claims in particular;
3 To promote discussion as to possible applications for GIS utilisation. This includes the exposing of difficulties and suggesting of solutions associated with the linking of computer mapping with the law in relation to legal practice.
A GIS may be utilised when geographic data needs to be collected, recorded, collated, manipulated, analysed and/or presented. Land claims and disputes lend themselves to the use of a GIS. In general terms claims under the case of Mabo v Queensland & the Commonwealth (Mabo No. 2)[1] and under the Native Title Act 1993 (Commonwealth) (NTA) require that:
1 the land be identified as Crown land where native title has not been extinguished;
2 the Traditional Owners of all or part of the land be identified;
3 an unbroken connection with the land be established, and that it be;
4 according to traditional laws acknowledged and the traditional customs observed (s. 223 NTA). Each of these elements may be recorded against the Spatial location in a GIS and any changes over time may be recorded.
Under the NTA "the non-extinguishment principle" (s 238) applies to certain land. This land may be identified and classified for further consideration and analysis. Again the time factor may be taken into account eg the status of the land before and after crucial dates including 1 July 1993 and 1 January 1994. The categorisation of "past acts" (s 228) and "future acts" (233) may be made for each parcel of land and each "act". Details of the Traditional Owners compared to grantees of statutory title over specific land may be recorded and analysed to determine the level of overlap in these two categories for the identified parcel(s) of land. This paper seeks to explain the workings of a GIS sufficiently to show that utilisation of a GIS in relation to Native Title claims would be both relevant and beneficial to those involved in the preparation and presentation of the claim. Figure 1 below illustrates the major features associated with past acts under the NTA. In relation to each parcel of land a map may be created or obtained and a database created or obtained which will allow the user to see the relationships between the various features associated with the land eg traditional owners, land classification and identification, leaseholders, and the status of the land in relation to past acts. The database may be queried in order to find out information and also to look at the relationships between items of data held in the database.
PAST ACTS s. 228 Native Title Act 1993 (Commonwealth)[2]
Figure 1: Validation of Past Acts
A Geographic Information System or GIS is "[a]n organized collection of computer hardware, software, geographic data, and personnel designed to efficiently capture, store, update, manipulate, analyse, and display all forms or geographically referenced information"[3].
OR in more friendly terms it is:
"A computer system capable of holding and using data describing places on the earth's surface"[4]
In a GIS there are two primary types of information:
1 location and;
2 the characteristics of that location (attributes)[5]
Location refers to a position on a map (representing a real position on the Earth) whereas attribute (data, information or description) is a characteristic associated with the real location. One location may have multiple attributes. A precise location on a map (eg at a given latitude and longitude) may be described as a point. The point may be tagged (labelled). The tag can then be used as a key to link attributes (data) to the point (location). The point may be the location of a tree which in turn is located on a known property owned by a specified person and subject to a land claim which is to be heard on a certain date by a known tribunal. Each piece of information or attribute feature (data) may then be recorded to form a database. It is the tag or key which enables the computer to identify and retrieve the data then link it with other data.
In relation to a GIS a map is a two dimensional representation on a flat surface of part or the whole of the Earth's surface which is three dimensional and curved[6]. There are various ways to translate a three dimensional curved surface into a two dimensional flat surface. One system is that of raster projections (which utilises grids) including the methods of:
1 allocating parallels of latitude and meridians of longitude; or
2 creating cell maps by raster; or
3 the Australian Grid Map (AGM) which uses the Universal Transverse Mercator (UTM) system.
The difficulty of the translation from a three dimensional curved reality to a two dimensional flat representation (map) may be visualised if we consider a balloon that is marked with a grid system over its entire surface then cut so as to be converted into a two dimensional flat surface. Either the grid will be made up of squares and portions of squares or the shape of the grid components will not be squares but some other four sided polygon. In either case some decision needs to be made to compact or extend (distort) some data so that in the map representation that data it is not technically proportional to all the other data on the map (see Figure 2).

Figure 2: World Map using UTM
An alternative system to the raster projection is the vector map which starts at a known point then records the direction and distance of any movement from that point (the vector). Each system produces a model which is merely a representation of the three dimensional reality.
The vector map uses points, lines and polygons (areas) to convert the Earth's curved and rough surface to a flat surface. A point is a single place marked on a map. It has no length, nor breadth and therefore has no area. A line is a series of points. It may be straight, curved or at an angle to another line. A line has length but no breadth. A polygon is a closed area. It is bounded by one or more lines which may be straight, curved, at angles to each other or some combination of these.
A map may have points or lines or polygons or any combination of these features illustrated on it. For these features (feature types) to be useful they need to be allocated a feature coordinate so that the sought after feature may be physically located on the map. Each feature must then be allocated an identifying number or Tag which is then used as the common feature or Key to link up all known data about the feature including its coordinates and any attributes associated with it. The nature of the feature is also linked to the Tag/Key ie whether it is a point, line or polygon. Any other data relating to the feature is known as a feature attribute and is placed in a record (row of a table) alongside the Tag/Key. Below is an example of a Grid Map (see Figure 3) with six features identified, each of which has been allocated one or more pairs of coordinates, a tag (ie feature or identification number) and one or more attributes. These features are two points (1 being the intersection of two roads and 2 being the location of a tree near a road), two lines (3 being a clay road and 4 being an asphalt road) and two polygons (5 a farm with clay soil and 6 a granite quarry). Each of these features can then be entered into a database (see Figure 4) which may then be accessed and the data within manipulated and utilised to answer specific queries.
Figure 3: Grid Map showing points, lines and polygons (areas)
The above grid map (Figure 3) shows the locations of points, lines and polygons (areas) as features on the Map as well as the feature numbers or tags (1 to 6 inclusive) associated with those locations. These features are then recorded in the composite database set out in Figure 4. The map is a visual representation of the data in Database 1. Database 2 contains the information and descriptions (attributes) relating to the features seen on the grid map with that information being tied to a location on the Grid Map relevant to it.
A database is "a large volume of information stored in a computer and organised in categories to facilitate retrieval"[7]. Each (location/point/tag) can then be linked to the one or more attributes that are associated with it. A GIS works by keeping two sets of records (databases 1 & 2). In database 1 the coordinate record (location) is allocated a tag[8] and in database 2 the attribute records are linked to the same tag in what is termed a feature attribute table. It is this link between the two records that allows the operator to query the map via the GIS "to display attribute information or to create a map based on the attributes stored in the feature attribute table"[9]. It is important to understand that "any two tables can be connected if they share a common attribute"[10]. (The accuracy of that connection is considered later).
Database Common Database
1 Feature 2
(Feature (Feature (Feature
Coordinates) Number) Attributes)
(Tag/Key)
Figure 4: Composite Database showing feature (coordinates, numbers/tags, attributes) (Adapted from Arc View User's Guide[11])
Above is a composite table (database) showing Database 1 (location) and Database 2 (feature attributes) and the linking common feature (feature number ie tag sometimes called a key[12]). It should be noted that normally Database 2 would be at least three separate tables. Firstly for the point locating the tree. Secondly for the lines setting out the roads (and perhaps the point showing the intersection of the roads). The third would show the areas (polygons) of landuse or ownership (or both). Each of the tables would correspond to a map showing a certain theme (set of features) eg roads. These maps showing themes (thematic maps) may then be overlapped to produce a composite map as set out above (see Figure 5)
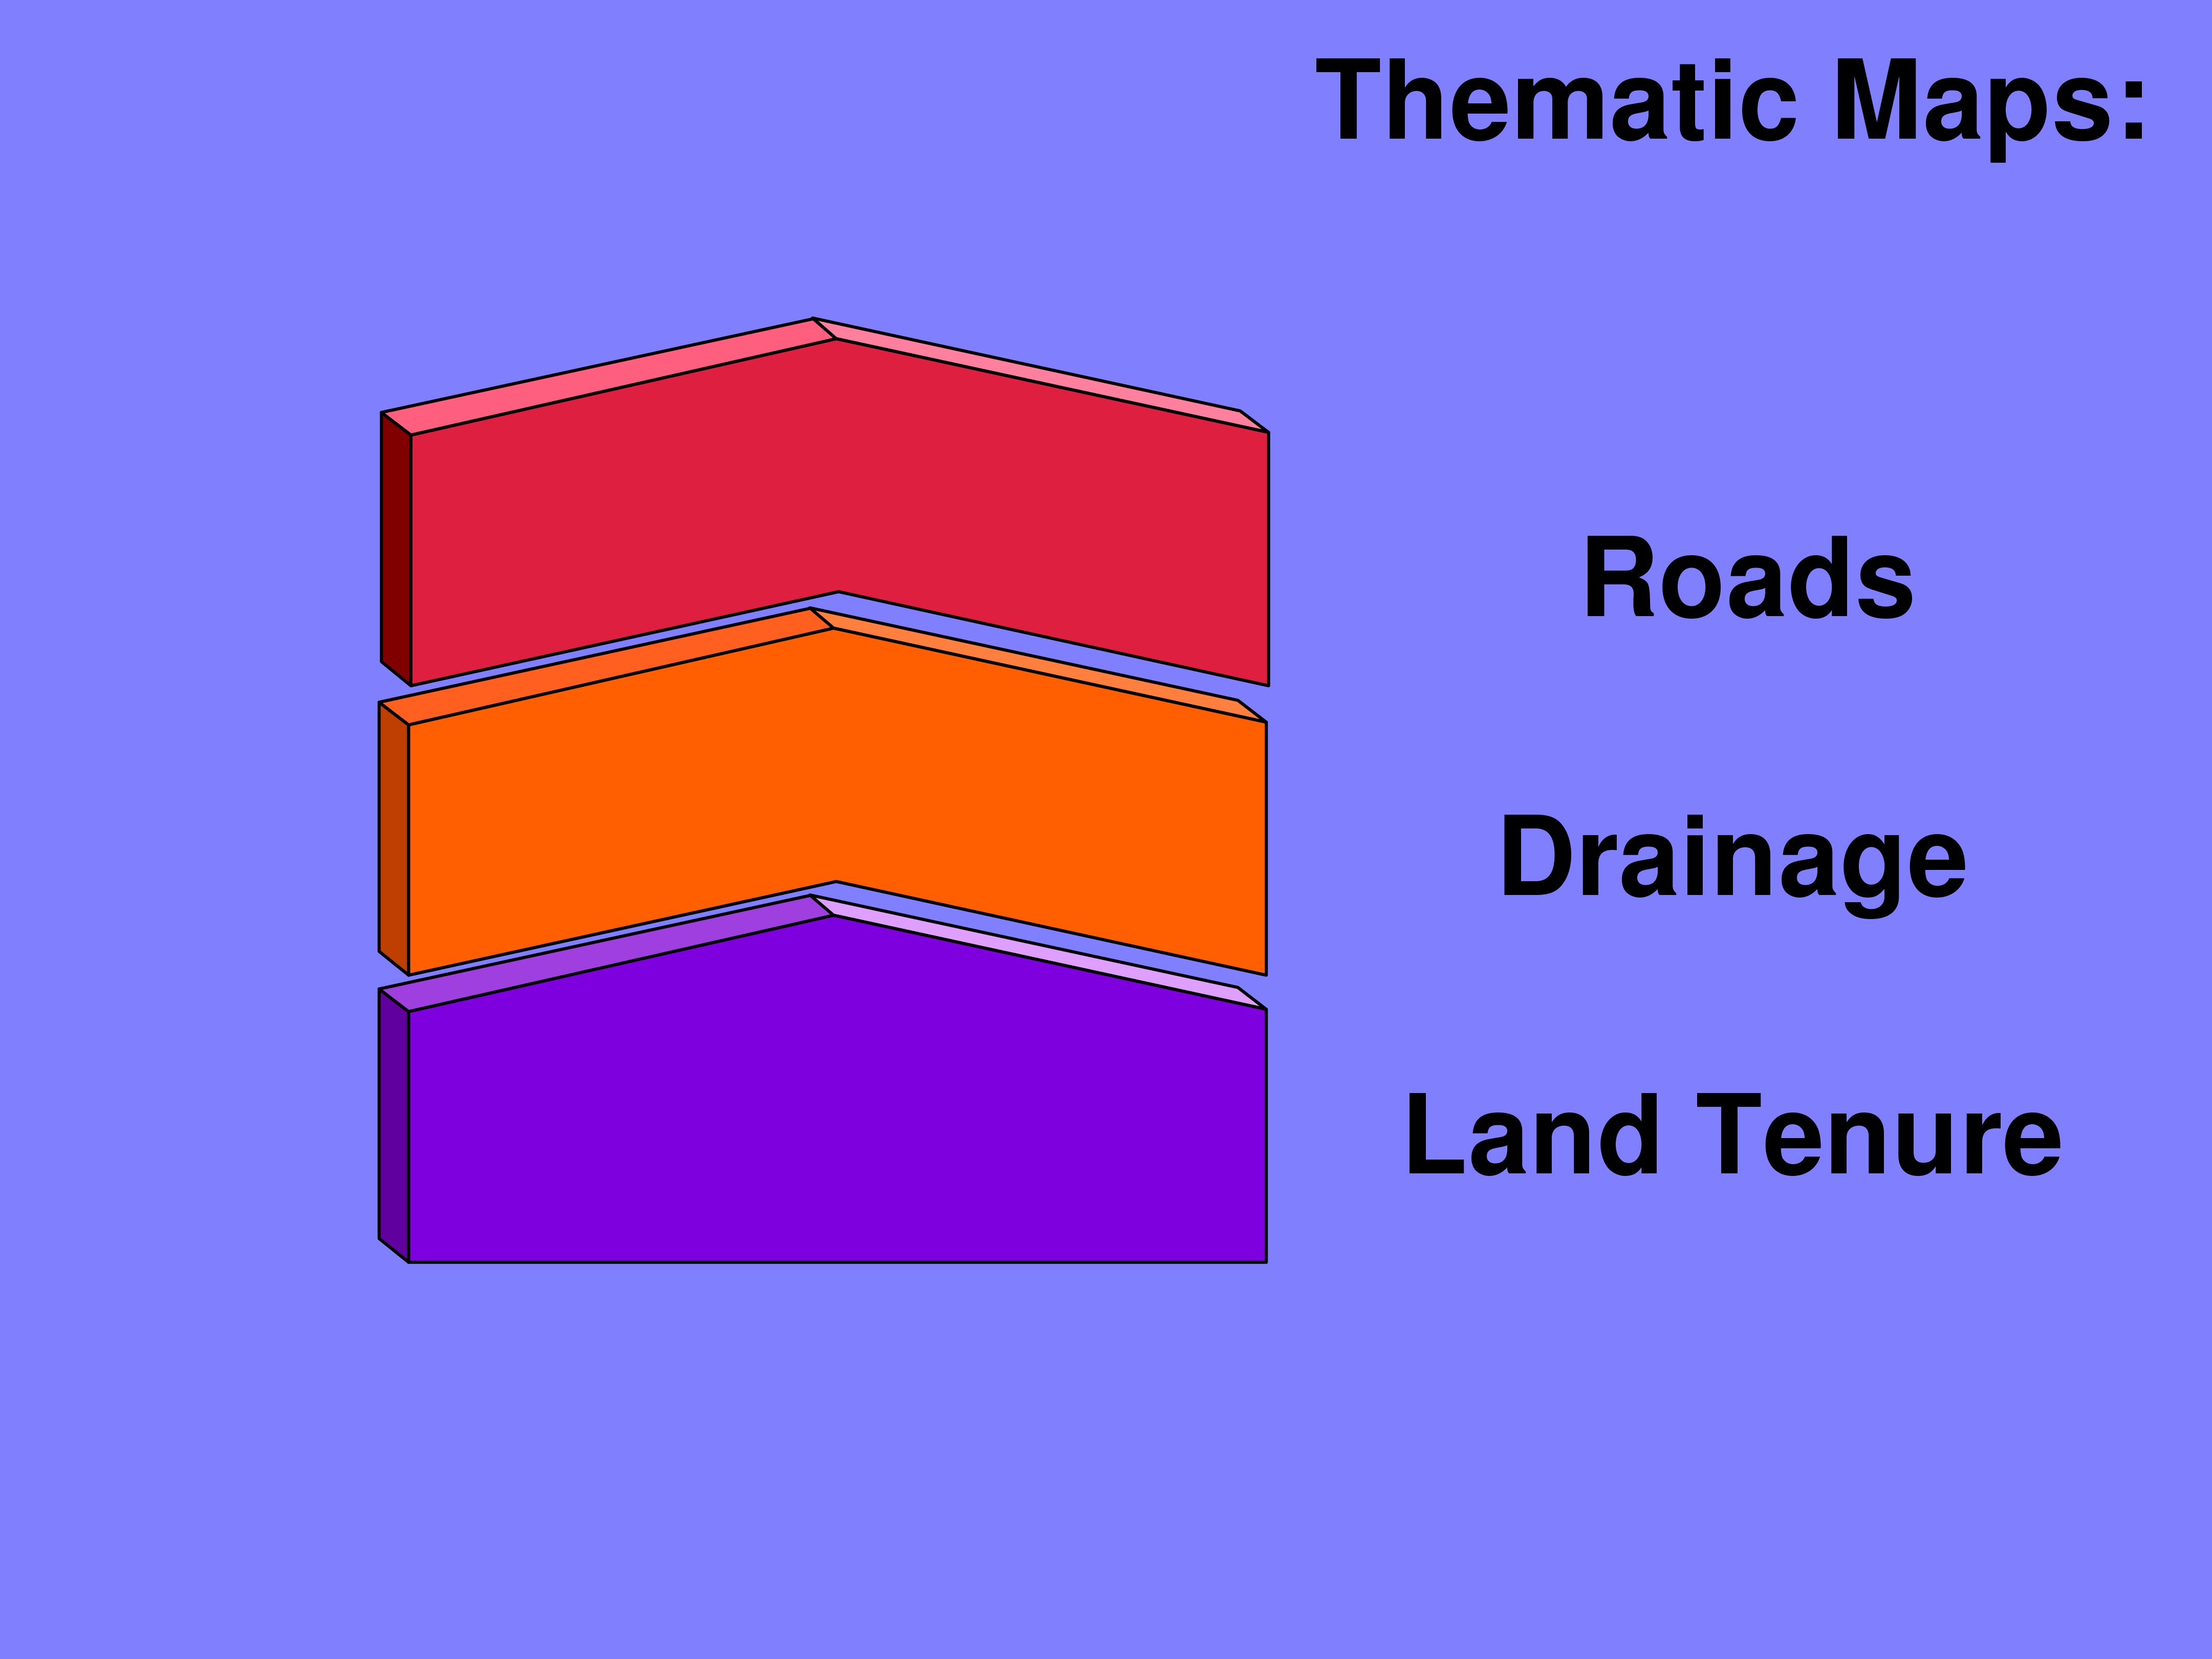
Figure 5: Thematic Maps: roads, drainage and land tenure[13].
The term "Spatial data" refers to information (data) located on a map. It records where one piece of data is located in relation to another piece of data. A GIS allows the operator to make Spatial queries. Some examples of Spatial queries are:
1 How many towns and cities are within 500 km of Darwin (or 100 km of Hobart)?[14]
2 Plots of Crown land larger than 500 hectares and within 200 km of the road from Eucla to Balladonia (WA)?
Spatial queries may be asked using a GIS and a Spatial database. The Spatial database stores values concerned with the exact location of something on the earth or a map of the earth (eg using latitude and longitude) or values concerned with a location in relation to some other known location or reference point (ie vectors)[15].
"A GIS typically links different data sets."[16] It is able to answer relational questions because "it uses geography, or space, as the common key between data sets"[17]. A GIS has two components to it, the mapping facility and the database which may be linked to specific locations on the map(s). The data is normally stored in themes or layers somewhat similar to map layers using overhead transparencies. One theme eg. population centres may be overlaid by further themes for the same geographic area eg roads, drainage and land tenure.[18] These maps are known as thematic maps. By having the data stored on a GIS queries may be made of the database and information extracted from a single theme or a combination of themes. These queries have a common link namely the geographical location of each item of data as represented on a map.
There is always some distortion in the transformation process so that if two sets of data come from two different types of map source (eg raster and vector) the data may not exactly correspond resulting in errors when the two maps (and their associated data) are laid one over the other. Even if the two maps are created using the same type of translation there may be errors and/or discrepancies due to other factors including:
1 when different scales are used (a map at scale 1:1 000 000 will not normally be as accurate nor as detailed as a map at a scale 1:400) and;
2 when the levels of accuracy used in the collection and input of the data are different.
To gain access to a GIS requires software, hardware and personnel either with knowledge and expertise relating to the utilisation of the GIS or the ability & time to gain that knowledge and expertise. The hardware at Charles Sturt University in Wagga Wagga is a Unix computer on which the GIS (Genamap) resides and through which the GIS is accessed from the users' machine (PC). The hardware at the University of Tasmania, Law School is an IBM compatible PC 486 DX2-66 Megahertz with 8 Megabytes of RAM[19], which allows for the relatively speedy transfer of and access to graphics and data located on the GIS database. To allow access to the GIS, Genamap, in Wagga Wagga requires that the PC in Hobart utilise X-WIN software that is resident on the PC. This is an X-emulation program that uses the PC as a server capable of displaying the information (maps & data).
To allow access to ARC/INFO (alternative GIS) the X-WIN software treats the PC as a server capable of displaying information. Access to ARC/INFO from the PC may also be obtained by using a program (software) known as Arc View. This program requires a further program (PC NFS[20]) to interpret between ARC/INFO and Arc View. The latter software is used as it is more user friendly than ARC/INFO. Further work and testing of ARC/INFO and Arc View will need to be done by the author before comparisons with Genamap can be made.
The creating of maps on the screen by building layers of themes is a relatively easy process once the correct commands and the sequence of their execution are learnt. The printing of those same maps is a more complex task that requires extra commands as well as someone to turn on, load and set the printer which can be a major problem if the printer is not located near the GIS operator. If for example the operator is in Hobart and the printer is in Wagga Wagga, hundreds of kilometres away, it is important to obtain the assistance and cooperation of someone in physical proximity with the printer. It is easier to use a printer with an existing link to the GIS (ie in Wagga Wagga) although it is possible to print at other locations eg University of Tasmania in Hobart. This latter option would mean that instructions would be issued from the PC in Hobart, travel via AARNET to the GIS in Wagga Wagga then return to Hobart again via AARNET with instructions for the printer.
Printing of maps may be in black and white (with shades of grey) but normally colour printing is required especially if more than a few themes are to be represented on the map. To print a map created (composed) using Genamap an output file is created which is then spooled to the chosen printer using FTP[21]. The “screen dump” followed by the “paste special” commands may then be utilised to copy and paste the screen details into some other program eg Microsoft Word (various versions) or PowerPoint (see Figure 6).
Figure 6: Diagram of the technological link from GIS to Screen (or Printers)
A screen dump captures (copies) the image as it is shown on the screen then allows for this image to be copied (pasted) into some other computer software program eg Word 6.0 or PowerPoint. The image may then be expanded or reduced in size.
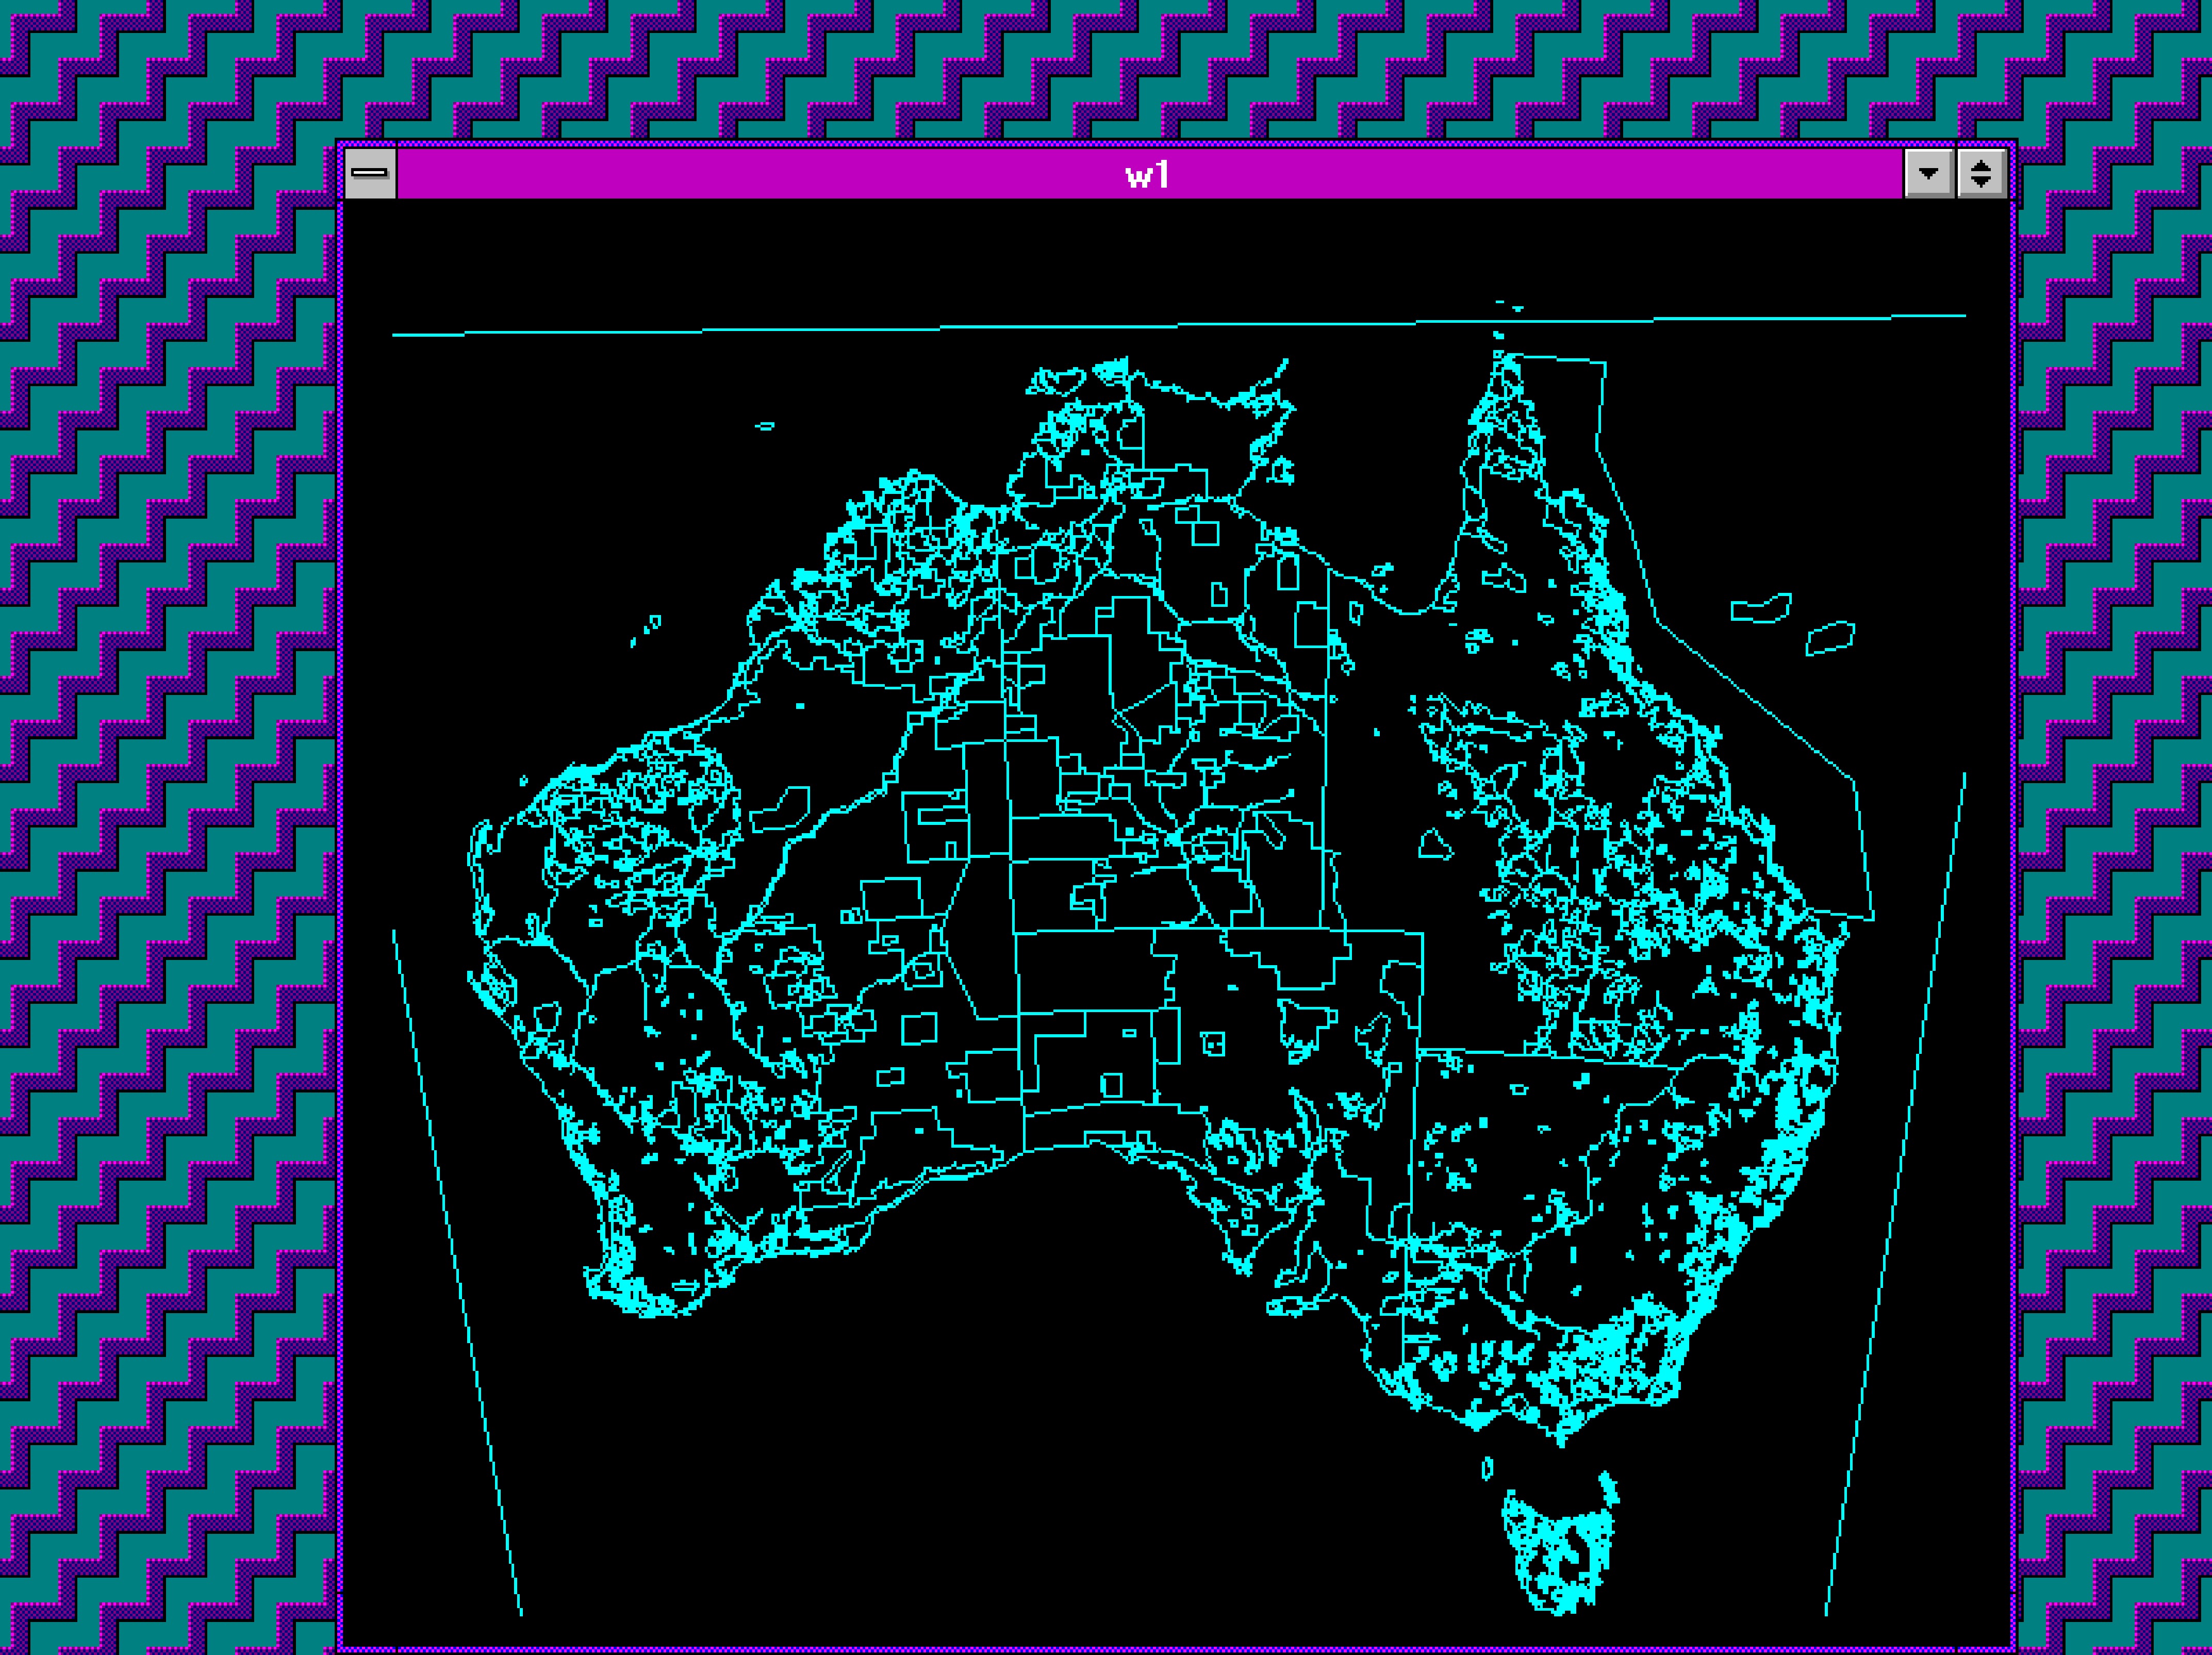
Figure 7: LAND TENURE MAP OF AUSTRALIA
Showing Public Land, Aboriginal and Torres Strait Islander Land (1993)
(Courtesy of AUSLIG and Centre of Image Analysis, Charles Sturt University - Riverina)
The image in Figure 7 is a screen dump of a GIS image that was copied from the PC screen into Word 6 (Microsoft). It can also be copied into PowerPoint for use in overhead slide presentations. One point to note is that the quality of the actual screen view and any printing done directly from the GIS (subject to differences in printer quality) are both normally superior to that of the screen dump and any printing produced from the screen dump.
Often information located in a database or on a map may be sensitive or it may be important that it be kept secret. In this case access to the data will need to be restricted in some way. If, however, access to the data is permissible it may be important to ensure that the original data is not altered or is only altered by someone who has permission to alter it. Some mechanism needs to be implemented in order to protect the custodians and owners of the data as well as the integrity of the data itself. A password is a combination of keyboard characters which are required to be entered into a computer (hardware & software) before access to certain software and data is allowed.
In Genamap there are various levels of protection for data and maps. At one level access can be denied to the operator unless the correct password is known. At the next level a map may be accessed even if the password is not known. The map may then be copied and that copy may be deleted and/or altered but the original map cannot be deleted nor altered unless the correct password is known (and entered). At the lowest level of security access to the map may be available to all operators without the need for a password. In this case the map may be deleted, altered, and copied provided the following rules are complied with.
A map (including a master map) cannot be deleted nor altered if the command "Protect" is current. "Protect will write protect maps that are not write protected"[22]. If password access is allowed write protected data and maps may be accessed and copied but not deleted nor changed. If the status of a map is "Expose" the data and maps may be accessed by the operator then deleted and/or altered provided the correct password is known or if the level of access is unrestricted. If the status of a map is “Protect” then it will be write protected until that status is changed to “Expose”.
The choice of GIS is dependant upon many factors including:
1. available access to a GIS;
2. familiarity with the particular system, eg Genamap & ARC/INFO;
3. user friendly level of the software;
4. cost (not directly considered in this paper); and
5. appropriate software, hardware and technical support.
Genamap does have the facility for pop-up menus but these are not generally available unless specialised programs are written to cater for the specific needs of the user. These programs require time, expertise and funds to establish and test. Without them Genamap is not as user friendly as it could be. Genamap requires time and access to it for the user to gain sufficient expertise in order to utilise it including establishing and meaningful database and being able to utilise the query function. A GIS may be a positive benefit to larger firms that can afford the establishment costs, infrastructure and support personnel required to support it. The client base would also be an important factor. Some of the questions that need to be considered include:
1 Is a GIS and its utilisation compatible with a general (or specialised) legal practice? (It can be for a specialised practice).
2 Is computer mapping useful for native title claims? (Yes).
3 Is computer mapping worth the cost in time, dollars and level of complexity that is required to use it? (This depends upon the client base and expertise of the practice).
4 Is computer mapping useful to your practice? If so how?
Attorney General’s Department, Native Title Legislation with Commentary by the Attorney General’s Legal Practice, 1994, Canberra, Commonwealth of Australia.
Delbridge (Ed) The Macquarie Dictionary, 1981, McMahons Point, Macquarie University Library Pty Ltd.
Environmental Systems Research Institute, Inc., Arc View: User's Guide, 1992, Redlands, CA., USA, Environmental Systems Research Institute, Inc..
Environmental Systems Research Institute, Inc., Understanding GIS: The ARC/INFO Method, 1990, Redlands, CA. USA, Environmental Systems Research Institute.
Genasys II, Genamap Reference Manual version 5.1 (August 1991), North Ryde, Genasys II Pty Ltd.
Mabo v Queensland & the Commonwealth (Mabo No. 2) [1992] HCA 23; (1992) 175 CLR 1; 107 ALR 1; 66 ALJR 408.
Native Title Act 1993 (Commonwealth)
AUSLIG, Public Land, Aboriginal and Torres Strait Islander Land, 1993, AUSLIG
[*] B.A., LL.B. (Macq), Lecturer in Law, Tutor for Overseas Law Students, Law Support Program Coordinator, Faculty of Law, University of Tasmania; Consultant Solicitor, Bryan G. Turner, Sydney, New South Wales; Practitioner, Tasmania. The original draft of this paper was presented to the Aboriginal Legal Issues Interest Group of the Australasian Law Teachers Association (ALTA) Conference hosted by and at the University of Tasmania Law Faculty in Hobart 30 September to 2 October 1994.
In the preparation and presentation of this paper the technical support of Bronwyn Lowe (Spatial Database Manager), Gary Mackenzie and Georgina Ashton - Charles Sturt University (Wagga Wagga) and Peter Jones, Simon and Rachel Morse - University of Tasmania (Hobart) is acknowledged and appreciated. The guidance of the respective Heads of the University of Tasmania Law School, Professor Michael Tilbury and Associate Professor Kate Warner, is also much appreciated. I wish to thank Professor Garth Nettheim and those attending the presentation at ALTA 30 September 1994 - Hobart for their valuable comments and also my colleagues Rohan Price and Marc Deegan, for their perceptive observations and suggestions on drafts of the paper. A very special thank you goes to my wife Wendy and our children for their encouragement and assistance.
[1] [1992] HCA 23; (1992) 175 CLR 1; 107 ALR 1; 66 ALJR 408.
[2] Figure 1 was adapted from “Native Title Legislation with Commentary by the Attorney General’s Legal Practice”, 1994 Commonwealth of Australia, Canberra, page C13.
[3] Environmental Systems Research Institute, Understanding GIS: The ARC/INFO Method, 1990, Redlands, CA. USA, Environmental Systems Research Institute, p 1-2.
[4] Ibid.
[5] Genasys II, Genamap Reference Manual version 5.1 (August 1991), North Ryde, Genasys II Pty Ltd, p 6.1 Attribute.
[6] Delbridge (Ed), The Macquarie Dictionary, 1981, McMahons Point, Macquarie University Library Pty Ltd, p 1068.
[7] Ibid p 473.
[8] The term "tag" is equivalent to the term "key".
[9] Environmental Systems Research Institute, Inc., Arc View: User's Guide, 1992, Redlands, CA., USA, Environmental Systems Research Institute, Inc., p 5-7.
[10] Ibid.
[11] Arc View: User's Guide, 1992, op cit p 5-7.
[12] The terminology used to describe the components of a GIS and how they are used differs slightly depending upon the GIS being used. Genamap and ARC/INFO are the two major GIS that the author has dealt with so that the various terms used by these two systems are explored in this paper (Tag=Key).
[13] Adapted from Clipart file “shapes.ppt”.
[14] Understanding GIS: The ARC/INFO Method, 1990, op cit p 1-2.
[15] Ibid, p 1-3.
[16] Ibid.
[17] Ibid p 1-6.
[18] Ibid p 1-2.
[19] RAM: Random Access Memory.
[20] Or some similar software (eg XFS).
[21] FTP: File Transfer Protocol.
[22] Op cit, Genamap Reference Manual version 5.1, 1991 p 5.1 Protect 1.
AustLII:
Copyright Policy
|
Disclaimers
|
Privacy Policy
|
Feedback
URL: http://www.austlii.edu.au/au/journals/JlLawInfoSci/1994/20.html