
|
|
Home
| Databases
| WorldLII
| Search
| Feedback
University of Technology Sydney Law Research Series |
Last Updated: 15 February 2017
Title: Electoral Redistribution in Australia:
Accommodating 150 Years of Demographic Change
Authors: John Juriansz
University of Western Sydney (Australia)
Brian Opeskin
Macquarie University (Australia)
Keywords: Australia, electoral boundaries, malapportionment, one vote
one value, population change, redistribution,
redistricting
Corresponding Author:
Professor Brian
Opeskin
Macquarie University
NSW 2109 Australia
Contact
details
T: +61–2–9850-7074
F:
+61–2–9850-7686
E: brian.opeskin@mq.edu.au
ABSTRACT
Electoral redistribution (redistricting) is a process that seeks to advance the principle of ‘one vote, one value’ in the face of dynamic human populations. Using the Australian federal electoral system as a case study, this article examines the impact of changes in the size, composition and spatial distribution of the population on electoral boundary delimitation over the past 110 years, and analyses the likely impact of future population change over the next forty years. The article concludes that the Australian electoral system has moved progressively towards greater equality of voting power encapsulated by the ‘one vote, one value’ principle. However, the capacity to achieve even greater equality through electoral redistribution is constrained by constitutional and pragmatic considerations.
ELECTORAL REDISTRIBUTION IN AUSTRALIA:
ACCOMMODATING 150 YEARS OF DEMOGRAPHIC CHANGE
The principle of ‘one person one vote, one vote one value’ is increasingly seen as a core value of modern electoral systems. While easy to state, it can be difficult to achieve in democracies whose representatives are elected from single-member electorates. A large part of the contemporary challenge arises from the dynamic nature of human populations, which are in constant flux in size, composition and spatial distribution. Each of these attributes is affected by patterns of fertility, mortality and migration, which can have markedly different impacts on electorates.
The redrawing of electoral boundaries is a key mechanism for promoting the ideal of ‘one vote, one value’ in dynamic populations. The process of electoral redistribution (also known as redistricting, re-riding or boundary delimitation) entails the review and redrawing of the geographic limits of an electorate to ensure that, as nearly as practicable, each electorate contains the same number of voters. In this way, each voter wields (in principle) the same relative voting power in electing representatives to the legislature. The frequency of electoral redistribution and the circumstances in which it occurs depend on a country’s legal and institutional framework, and its political culture. Historically, Australia has experienced its share of gerrymanders, notably in Queensland,[1] but in recent decades electoral redistribution has been driven less by partisan politics than by population dynamics.
This article examines the demographic dimension of electoral redistribution in Australia, limiting the inquiry to the federal electoral system but taking a broad historical sweep from 1901 to 2010. It also examines population projections to 2051 with the aim of assessing the impact of future population changes on the federal electoral system.
The article pursues two intertwined themes—first, the way in which population change has driven electoral redistribution in Australia; and second, the impact of population-driven electoral redistribution on voter equality. It is not necessarily true that more frequent redistributions lead to greater voter equality—this depends on the nature of the redistribution process itself. An important subtext of the present study is therefore the evolution of the legal and institutional landscape of electoral redistribution, and the gradual acceptance of voter equality as a guiding principle within that landscape.
In relation to the first theme, the central finding of this study is that demographic change has been a major trigger of electoral redistribution in three ways. Increases in population size have been an impetus for creating new electorates by enlarging the lower house; changes in the spatial distribution of the population between states have affected the electoral entitlement of each state; and changes in the spatial distribution of voters within states have triggered intra-state redistributions. Of the 85 federal electoral redistributions since 1901, 72 (85 per cent) have been triggered by demographic processes.
In relation to the second theme, the central finding here is that the federal electoral system has moved progressively, if somewhat unevenly, towards greater equality of voting power encapsulated by the ‘one vote, one value’ principle. Yet, the capacity to make further inroads into voter inequality is constrained by three circumstances—the guarantee of at least five seats for each state; the rounding errors that arise from allocating a finite number of electorates among the states and territories; and the willingness of the legislature to provide for representation of the territories in ways that sometimes differ from the principles applicable to the states.
The relentless changes in Australia’s population over the past century have been paralleled by equally significant changes in the system of electoral redistribution. The discretionary power of the executive to call for redistributions (or ignore the patent need for them) has been reduced, and the process has been institutionalised in the hands of an independent electoral commission. New redistribution triggers have been introduced, and existing triggers refined, so that the process is ever more responsive to the dynamics of population growth, composition and spatial distribution. And the enhanced capacity of electoral and statistical agencies to project future geospatial attributes of the population has also made the redistribution process more sensitive.
The article is organised as follows. Part 2 describes the key legal and institutional features of Australia’s federal electoral system in so far as they relate to redistribution. Part 3 summarises the main population trends in Australia since federation. Part 4 identifies five redistribution triggers and discusses their historical significance. Part 5 uses longitudinal data to assess whether voter equality has improved in Australia over the past 110 years, using demographic data from the Australian Bureau of Statistics[2] and electoral data from the Australian Electoral Commission[3] and other published sources.[4] Part 6 analyses those redistribution triggers that have demographic relevance. Part 7 analyses the impact of projected population growth on electoral redistribution over the next forty years. Part 8 offers a brief conclusion.
Australia has a bicameral federal system of representative democracy, with single-member electorates for the House of Representatives based on universal suffrage for adults and compulsory voting. The Senate is composed of an equal number of representatives from the six States. In 1901, the Australian Constitution established the Senate with 36 members (six per state). After several enlargements, the Senate now stands at 76 (12 per state and two from each internal territory). Because each state comprises a single electorate for the purpose of senate voting,[5] and state boundaries are now stable, electoral redistribution plays no role in that chamber.
The lower house is composed of members directly chosen by the Australian people. The size of the House must be ‘as nearly as practicable’ twice the number of senators, which has been judicially interpreted to mean twice the number of state senators.[6] In 1901 the House was established with 75 members. In line with the expansion of the Senate and the required nexus between the sizes of the two chambers, the House has also been enlarged on several occasions. It presently comprises 150 members, including two representatives from each of the two internal territories.
The Constitution contains four provisions that directly affect federal electoral redistribution. First and foremost is the requirement that federal electorates be allocated to each state ‘in proportion to the respective numbers of their people’ (s 24). A provisional formula is given for achieving this goal, which is now replicated with additional detail in federal legislation:[7] one first calculates a quota (the total population of all States divided by twice the number of state senators) and then divides the population of each state by the quota. The quotient, once rounded up or down, gives the whole number of representatives allocated to each state. Because electoral law mandates single-member electorates, the formula also gives the number of House of Representatives seats to which each state is entitled.
The second constitutional provision is the guarantee of at least five members of the lower house to each state, irrespective of the formula (s 24). At federation, this bolstered the entitlements of the two least populous states, and to this day it continues to favour the state of Tasmania, whose population share has continued to decline and whose formula entitlement would otherwise be only three members. Thirdly, state boundaries are to be respected in determining federal electorates, which ‘shall not be formed out of parts of different states’ (s 29). Finally, the Parliament is given power to allow for the representation of the territories in either House of the Parliament on such terms as it thinks fit (s 122).
Within these constitutional parameters, the Australian Parliament has a free hand to determine the federal electorates for which members of the lower house are chosen. Soon after federation an office was established to superintend federal electoral matters, including the redistribution process. The earliest incarnation was as a branch of the Department of Home Affairs, which left a great deal of power to the government of the day. Many incremental changes were made in the decades that followed, but the most significant came in 1984 when the Australian Electoral Commission was established as an independent statutory authority charged with administering the electoral redistribution process. Although independence is never absolute—for example, the Government still appoints the principal officers and determines the Commission’s budget—the role of the Commission is now relatively uncontentious[8] and may be seen as part of a broader pattern of electoral integrity produced by parliamentary rule-making and non-partisan bureaucratic administration.[9]
Electoral redistribution today is primarily a response to change in the number of residents and the number of voters. Electoral redistribution has regard to the number of residents when allocating federal electorates to each state under the entitlement formula discussed above. It is justified by the principle that democratic representatives are representatives of the people, not just the voters. Electoral redistribution has regard to the number of voters in determining the geographic boundaries of electorates within a state, and it is justified by the principle of equality of voting power, which by definition can be enjoyed only by voters.
The resident population will inevitably differ in size and composition from the sub-population of voters. Voting in Australia is restricted to citizens who are at least 18 years of age—apart from a grandfathering clause that allows about 160,000 British subjects to vote who are permanent residents and were on the electoral roll before Australia Day 1984.[10] The relative size of residents and voters can be seen in Figure 3, but there may also be compositional differences that may be significant for some purposes at the level of individual electorates.
Changes in Australia’s population can be considered across four interconnected dimensions: population size, the components of population change, population structure, and spatial distribution. As to size, the Australian population has grown significantly since federation, from 3.79 million people in 1901 to 22.41 million in 2010—a six-fold increase. Population size is relevant to electoral redistribution because it has been the impetus for changes in the size of the legislature, which in turn has triggered Australia-wide redistributions.
The second dimension is the components of population change. Populations change as a result of three processes—fertility which augments the population through births; mortality which diminishes the population through deaths; and migration which may augment or diminish the population depending on the direction of the net movement. Net natural increase (births minus deaths) was for a long time the most important contributor to annual population growth in Australia, but this has been overtaken in the past decade by strong net migration.[11] Because net natural increase and net migration have distinct spatial patterns, the balance between them has electoral implications. For example, fertility is generally lower in metropolitan areas than in rural areas,[12] and within cities fertility is generally higher in outer suburban areas than inner suburban areas.[13] Mortality differentials also show distinct spatial patterning.[14]
The structure of a population, and especially its age-sex composition, is the cumulative impact of changes in fertility, mortality and migration over long periods of time. The twentieth century witnessed a significant reduction in Australian fertility from a peak of 3.5 births per woman in 1961 to less than two births per woman, below replacement level fertility.[15] There has also been a significant reduction in mortality, with life expectancy at birth increasing from 52 years to 79 years for males and from 56 years to 84 years for females between 1901 and 2007-09.[16] The structural impact of these processes has been a significant ageing of the population.[17] This has implications for electoral demography in so far as it affects the population entitled to vote. At federation, when the voting age was 21 years and the population structure was very young, only 53 per cent of the population was eligible to vote based solely on age (discounting other qualifying conditions). By 2011, with a lower voting age of 18 years and a relatively older population, 77 per cent of the population was eligible to vote based on age alone, and this is projected to increase to 80 per cent by 2056.
The fourth dimension is the spatial dimension of the population, which is highly relevant to electoral redistribution. Australia’s population has a highly uneven distribution, with a large proportion living in a narrow coastal belt in the south-east corner of the continent, leaving an arid interior of extremely low density. This has led to some of the largest electorates in the world, with a single federal electorate in Western Australia covering 1.6 million km2—nearly three times the size of metropolitan France—yet representing only 86,000 people.[18] The spatial distribution of the population has also changed significantly over time, making it ‘one of the most dynamic and policy-relevant dimensions of the nation’s contemporary demography’.[19]
One of the major demographic forces driving differences in population growth between areas is international and internal migration. Overseas migrants do not settle evenly across Australia; the vast majority settle in the most populous states. In 2008-09, New South Wales absorbed about 30 per cent of migrants, Victoria 27 per cent, Queensland 19 per cent and Western Australia 15 per cent.[20] Internal migration is a further cause of differential population growth and hence electoral redistribution. Australia is a highly mobile society, with around 17 per cent of the population moving each year.[21] A large proportion of interstate migration is to Queensland and Western Australia. Patterns of internal migration also include relocation to coastal areas (the ‘sea-change’ phenomenon), and to green rural areas just beyond the frontiers of major urban centres (the ‘tree-change’ phenomenon).[22]
Since 1901 there have been 85 federal electoral redistributions.[23] Voter equality was not universally embraced in the early years of federation, but since the 1970s redistributions have generally sought to advance equality of representation inherent in the principle of ‘one vote, one value’.
The redistribution process is undertaken to ensure that each state and territory has, as nearly as practicable, representation in the House of Representatives in proportion to its population, and the same number of voters in each electorate of that state or territory. To achieve these goals, redistributions can be triggered by five events: (1) government or legislative initiative, (2) changes in the size of the legislature, (3) changes in the population shares of the states, (4) malapportionment, and (5) passage of time. Across all triggers, electorates were redistributed about once every ten years until 1983 but the introduction of mandatory triggers has increased the frequency of redistributions to about once every five years.
Executive or legislative initiative
Australia’s first federal electoral law provided that redistributions were to be initiated at the discretion of the Governor-General (acting on ministerial advice). From 1905, this discretion was refined so that the government of the day could initiate redistributions in three circumstances, namely, whenever the number of members of the House of Representatives to be elected for a state was altered; whenever an electorate deviated from the established population quota (malapportionment); or whenever the Governor-General saw fit. The discretionary nature of the process during this period is reflected as much in the redistributions that did not occur as in those that did. From 1901–1975, 35 redistributions proposed by the Redistribution Commissioners were rejected or ignored by the government, often in pursuit of political advantage.
Government or legislative initiative has been an historically important trigger in Australia, accounting for 13 of the 85 redistributions (15 per cent). However, the broad discretion to initiate redistributions was diminished by successive electoral reforms. Federal electoral law now provides an exhaustive list of redistribution triggers, leaving no room for discretionary redistributions in the states at the behest of the executive or the legislature. In the case of the territories, the legislature has retained its power to determine the representation of territories in either House of Parliament as it thinks fit. For example, in 2003 the Parliament exercised this power by setting aside a determination of the Electoral Commissioner, and thus giving the Northern Territory a second electorate to which it would not otherwise have been entitled when it narrowly fell short of the required population quota by 295 residents.[24] Subsequently, the electoral law was amended to allow a margin of error in estimating a territory’s population when determining its electorate entitlement.[25]
Changing size of the legislature
The legislatures of many liberal democracies have expanded over time in response to population growth and the desirability of maintaining a positive correlation between the number of people governed and the number of people representing them.[26] It also reflects the increasing complexity of modern day legislative functions and the need for sufficient representatives to perform those functions.
In democracies with single-member electorates, an increase in membership of the lower house requires new electorates to be formed from existing territory, and therefore existing electoral boundaries to be redrawn. The Australian Constitution stipulates that the first Parliament should comprise 36 senators and 75 members but it gave Parliament power to make laws altering that number. When the Parliament was enlarged on two occasions in the twentieth century, ten state-wide redistributions were automatically triggered, and three additional redistributions were initiated at the government’s discretion, to accommodate the new allocations of electorates.
Changing population shares of the states
The constitutional principle that the number of federal electorates in each state is to be proportional to the population of that state recognises that populations are dynamic and that each state’s population share will change over time in response to regional variations in fertility, mortality and migration.[27] As the relative populations change, electorates will be lost from one state and gained in another, triggering redistributions in both states. Changes in the spatial distribution of Australia’s population have accounted for 38 of the 85 redistributions (44 per cent).
Malapportionment
The principle of ‘one vote, one value’ requires single-member electorates to contain approximately equal numbers of voters—any significant departure from this norm is regarded as malapportionment. In the United States, constitutional principles require a very high degree of numerical precision in service to the ‘one vote, one value’ principle, especially in securing racial equality in voting power.[28] Other jurisdictions have a greater tolerance for variance. New Zealand allows a variation of 5 per cent above or below the average enrolment per electorate; Australia allows 10 per cent, Germany 15 per cent, Canada 25 per cent, and Singapore 30 per cent.[29] Malapportionment can be cured by expanding or contracting an electorate’s geographical boundaries to include greater or fewer voters. In Australia, malapportionment has accounted for 12 of the 85 redistributions (14 per cent).
Passage of time
The idea that electoral boundaries should be reviewed periodically, regardless of other triggers, has a venerable history. In 1787 the United States Constitution mandated that a census be taken every ten years for the purpose of conducting an electoral redistribution. The Australian Constitution did not impose such a requirement, though it was envisaged that redistributions would be conducted every five years, following the national census. However, as both census and redistribution were not mandatory, each was routinely postponed at the government’s discretion and periodic redistributions did not become institutionalised.
In 1975, the Australian High Court held that the electoral entitlement of each state had to be determined prior to every federal election, not just in response to the (by now) quinquennial census.[30] The 1983 electoral reforms brought additional changes by requiring a redistribution if seven years had elapsed since the last redistribution in that state. The intention of this trigger was to allow three general elections to be held on one set of boundaries (unless redistribution was triggered another way), given the three-year parliamentary term. Since 1983, the ‘passage of time’ has triggered redistributions in every Australian state and territory except Queensland—13 (15 per cent) in total.
The seven year limit falls comfortably within the recommendation of the Venice Commission, namely, that the distribution of seats be reviewed at least every ten years.[31] Many countries adopt the ten year rule (Canada, Japan and Mexico), while others allow 12 years to pass (Ireland, United Kingdom, France) or even longer.[32]
The Australian federal electoral system has delivered greater voter equality as the population has changed and as the redistribution process has matured. The concept of voter equality employed here is much narrower than the concept of ‘political equality’. The latter can embody economic, sociological and institutional dimensions, but even within the limited arena of formal structures for electoral decision-making, different criteria have been suggested for determining equality.[33] The criterion that comes closest to the useage in this article is that each voter has the same statistical probability of casting a vote that decides the election.[34]
There is a voluminous social science literature on the measurement of inequality and a well-developed sub-literature applying various measures of inequality to the context of electoral systems, or developing new measures for that purpose.[35] Early examples included the David-Eisenberg Index,[36] measuring the ratio of largest to smallest electorates, and the Dauer-Kelsay Index,[37] measuring the smallest percentage of the total enrolment required to produce a majority in the legislature. In Australia, Hughes has applied these indices, and the Gini index, nationally and to each of the states for the period to 1984.[38] More recently, one of the most-widely used measures of malapportionment, the Loosemore-Hanby Index,[39] has been applied by Samuels and Snyder to examine cross-sectional data for 78 countries.[40] In their calculations, Australia in the late 1990s was the 22nd best-apportioned country of those surveyed, and third best-apportioned of the 14 federations included in the sample.
The analysis in this article differs from other studies in three respects. First, it examines longitudinal data to show how voting inequality has changed over time, although few studies have taken this approach.[41] Secondly, it decomposes voting inequality into two components, namely, malapportionment that arises within a state from differentials in the number of voters per electorate, and malapportionment that arises between states from the allocation of electorates to states under the entitlement formula. This is an important distinction because the root causes of voting inequality differ, as do the degree to which they can be remediated. Thirdly, the article proposes a metric for quantifying the extent of malapportionment under each component.
Malapportionment within states
The first metric measures, for each election and each state, the average proportion by which the number of voters in electorates deviates from the average voter enrolment in that state. This measure has the desirable qualities of being independent of the size and number of electoral districts; of taking into account all data points in the distribution of electorates; and of avoiding skewness that can arise from the deviations being either positive or negative. The derivation of the metric—here called the Index of Enrolment Deviation (IED)—is given in the Appendix. It involves calculating the average number of voters per electorate; determining the proportion by which enrolment in each electorate deviates from the average; and aggregating the deviations through a weighted average, using the number of voters in each electorate as weights. The result of applying this process across all 43 federal elections and all states since 1901 is shown in Figure 1.
[insert Figure 1 about here]
There are several notable features of the graph. The first seven decades of the twentieth century were characterised by a high degree of malapportionment, which frequently exceeded 20 per cent of the average state enrolment. Malapportionment was particularly pronounced in the 1960s when recommendations of the Distribution Commissioners were routinely thwarted by partisan politics. The level of malapportionment shows a distinct cyclical pattern during these early decades, and the remedial effects of electoral redistributions are revealed in the successive troughs in the index, followed by a rise of voter inequality in succeeding elections. Since the 1970s, there has been a dramatic reduction in the both the extent and variability of malapportionment, corresponding with the reduction in permissible variation in the number of electors in an electorate to ±10 per cent in 1973; the introduction of mandatory redistribution triggers in 1977; and the expansion in the range of triggers in 1983.[42] For the past thirty years, malapportionment has fallen within a narrow band in all states—generally 2–7 per cent of average state enrolment.
Malapportionment between states
The second metric measures the degree of malapportionment arising between states as a result of the formula for determining the entitlement of each jurisdiction to lower house seats. The derivation of the metric, here called the Index of Population Deviation (IPD), is given in the Appendix and comprises the following steps. (a) Ascertain the number of electorates allocated to each state and determine each state’s proportionate share of the total number of electorates for the lower house (‘the electorate share’). (b) Calculate the state population that would be implied by the electorate share if there were exact proportionality between population and the number of electorates (‘the imputed population’). (c) Calculate the proportionate deviation between the actual and imputed populations using a simple transformation to preserve the relative symmetry of positive and negative deviations. In this case the sign of the deviation is retained to indicate whether a state is over or under represented.
For example, in 2010 New South Wales was entitled to 48 of the 150 lower house seats. The imputed population for New South Wales is thus 48/150ths of the total Australian population, or 7.144 million. Since the actual population of the state in 2010 was 7.232 million, the entitlement formula under-represents the state in the lower house. But by how much? The ratio of actual to imputed population is 7.232/7.144 million (=1.012), which subtracted from 1.0 gives an index of –0.012 or –1.2 per cent. The interpretation of the index is straightforward—the state is under represented in the lower house by 1.2 per cent because the state’s actual population is greater than that implied by its electorate entitlement.
Figure 2 shows the Index of Population Deviation across all states and territories for 43 federal elections from 1901–2010. Data points above zero reflect over representation, while those below zero reflect under representation. For five states, the degree of deviation has fallen in the range ±10 per cent since the earliest years of federation. However, Tasmania has been substantially over represented in the lower house since 1901—a product of its five guaranteed seats and a steadily declining population share. The enlargement of the lower house in 1948 and 1983 sharply diluted Tasmania’s over representation in those years. Nevertheless, by 2010 there was a 47 per cent discrepancy between Tasmania’s electorate entitlement and its population. Another feature of the graph is the erratic experience of the two territories. Given their small populations, the addition or subtraction of a single seat may cause them to swing between under and over representation—exemplified by the Australian Capital Territory gaining a third seat in 1996 and losing it in 1998, and by the Northern Territory gaining a second seat in the 2001 election and retaining it by legislative fiat in 2004. Figure 2 thus reveals a number of legal and pragmatic impediments to the pursuit of further voter equality.
[insert Figure 2 about here]
Redistribution following population growth and legislative enlargement
Electoral redistribution can be triggered by increases in the size of the legislature, which is itself a response to long-term population growth. We previously noted the six-fold increase in Australia’s population, from 3.79 million in 1901 to 22.41 million in 2010. This increase has been reflected in the enlargement of the legislature. The first Parliament was established in 1901 with an upper house of 36 senators distributed equally between the states and a lower house of 75 members distributed in proportion to each state’s share in the total population. In time, as the population grew, Parliament thought it advisable to increase the size of the legislature—first in 1948 and again in 1983. The mechanism through which this was achieved was the expansion of the Senate, since the ‘nexus provision’ in s 24 of the Constitution automatically requires the lower house to have ‘as nearly as practicable’ twice the number of senators.
When introducing the legislation in 1948, the Government justified the increase by reference to the doubling of Australia’s population since federation, and to the great expansion in the responsibilities of government following two world wars and the Great Depression. Australia was seen to have ‘altogether outgrown’ the small parliamentary bodies with which it was equipped in 1901.[43] The increase in the number of senators per state, from six to ten, resulted in 24 new senators, and the nexus provision brought approximately twice that number of new members to the lower house. Thus the 75 or 76 electorates that had existed between 1901 and 1948 had to be redrawn as 123 electorates. This automatically triggered redistributions in five states; but not in Tasmania, whose electoral entitlement was determined not by its population share but by its constitutional guarantee of five seats. In the result, the government exercised its discretion to initiate a redistribution in Tasmania as well, although the number of Tasmanian seats remained unchanged. All other states benefitted by the addition of new electorates, and they did so in proportion to their populations.
In 1983 reference was again made to the doubling of the population since the last major increase in the size of the Parliament (from 7.5 million in 1947 to over 15 million), and to the increasing number of voters in each constituency. The volume of legislation had grown fourfold in the past 60 years; a robust committee system was necessary for legislative oversight of the executive and demanded more parliamentarians; and the increase in the size of the ministry by 70 per cent since 1949 simultaneously eroded the pool of parliamentarians available to perform committee tasks. In the government’s view, the Australian people now had much higher expectations about what their representatives should achieve, and meeting those expectations required more hands on deck in managing a complex national economy.[44] Accordingly, 12 senators were added to the upper house (two per state) and 23 members were added to the lower house.[45] Again, redistributions were automatically triggered in five states, and the government exercised its discretion to initiate redistributions in Tasmania and the Australian Capital Territory. States other than Tasmania gained between two and eight electorates, giving a present day total of 147–150 electorates.[46]
The effect of enlargement of the legislature on the average number of residents represented by each member of the lower house, and on the average number of voters enrolled in each electorate, is shown in Figure 3. Increases in the size of the legislature brought sharp downward adjustments to the ratio of residents to electorates, and voters to electorates, but the effects have been systematically eroded over time. The benefits of enlarging the lower house in 1948 were fully offset within 23 years, while the benefits of the smaller enlargement in 1983 lasted only 13 years. Thus, while the size of the lower house has increased as the population has grown, the increase has been less than proportionate.[47] This has been a common phenomenon globally—parliaments cannot expand indefinitely, or even in strict proportion to population, because as they grow they become less and less capable of functioning as assemblies.[48]
In 1788 James Madison intimated that ‘no political problem is less susceptible of a precise solution than that which relates to the number most convenient for a representative legislature’.[49] A primary motivation for increasing the size of a legislature is to increase the ‘closeness’ of democratic representation rather than voter equality. Nevertheless, increasing the number of electorates can improve voter equality because it allows better calibration of the electoral system, such as reducing the inequalities that arise from rounding when applying the entitlements formula.
[insert Figure 3 about here]
Redistribution following spatial population shifts between states
Demographic change drives electoral redistribution in Australia not only because of growth in the size of the population but because of changes in its spatial distribution. Each state’s share of the total population determines its entitlement to seats in the lower house, and as those shares change, so does the allocation of electorates between the states. For this purpose, only population shifts between states are significant. Shifts in population within a state are not picked up by the entitlement formula, although they are relevant to electoral redistribution resulting from malapportionment.
Since federation, there have been notable shifts in the population between states, particularly towards the northern and western parts of the country.[50] Many reasons have been given for the change, including economic opportunities, lifestyle choices, and marketing campaigns.[51] While the year-to-year changes are small, their cumulative impact on electoral entitlements is significant, as shown in Table 1. In 1901, the population concentrated in the south-east corner of the continent (New South Wales, Victoria, South Australia and Tasmania) accounted for 82 per cent of the total population. In 2010, the population share of those states had declined to 67 per cent. By contrast, there has been substantial growth in the population share of the north (Queensland, +7.0 per cent) and the west (Western Australia, +5.2 per cent) over that period.
[insert Table 1 about here]
The spatial shift of population towards the north and the west has been matched by a corresponding shift in electoral entitlements. This effect is partly masked by the increase in the total number of electorates resulting from enlargement of the lower house. However, the real impact can be seen by examining the number of electorates each state would be entitled to in 2010 if Australia had the same population distribution that prevailed in 1901. The last column in Table 1 shows that New South Wales’ present entitlement (48 electorates) is four below this standardised population (52 electorates). The effect of diminishing population shares is also evident in Victoria, South Australia and Tasmania. Conversely, the growth state of Queensland is today entitled to 30 electorates although it would have been entitled to only 19 if the population were distributed as at federation.
The method for determining the electoral entitlements of the states based on their population shares is not an exact science. Electoral law seeks to give it a degree of precision by requiring the Electoral Commissioner to determine the population of each jurisdiction exactly 12 months and one day after the first meeting of a newly elected House of Representatives, and then to determine the electoral entitlements for the next election.[52] But intercensal population estimates are only estimates. Censuses contain errors of undercount and overcount, and the methods used to estimate populations between censuses may not reflect a population’s actual experience of fertility, mortality and migration over that period.[53]
Moreover, even if population data are exact, the rounding procedure inherent in the entitlement formula can lead to measurable differences in the weights attached to votes in different states. Population differentials of just a few hundred people can make the difference between one more, or one less, seat for that state, depending on whether the quota is rounded up or down. For example, a state that is entitled to 10.51 quotas will be allocated 11 electorates, while one entitled to 10.49 quotas will be allocated only 10 electorates. This difference impacts on the average number of voters per electorate, and the impact is more acute the fewer the electorates.
Redistribution following spatial population shifts within states
From a starting point of perfect voter equality, malapportionment arises from spatial variations in the rates of growth of different electorates, reflected in the number of voters per electorate. For federations like Australia, malapportionment between electorates within a state must be considered alongside the inequalities that arise from the allocation of electorates between states.
The ‘one vote, one value’ principle is most clearly expressed in Australian electoral law in the requirement that the Redistribution Committee shall, as far as practicable and subject to statutory considerations, endeavour to ensure that an equal number of voters are enrolled in each electorate for a given state or territory.[54] The qualification (‘as far as practicable’) recognises that the variability and unpredictability of demographic change renders exact voter equality impossible both at a point in time and over time.
Demographic change is accommodated by allowing electorates to vary in size by 10 per cent more or 10 per cent less than the average enrolment of voters in that state. As the number of electorates allocated to each state is roughly proportional to the number of residents in that state rather than the number of voters, and as the entitlements formula generates problems of rounding referred to above, the subsequent calculation of average voter enrolment is peculiar to each state. Accordingly, variations of voter enrolment between states may be significantly greater than the ±10 per cent variation permitted within a state.
This can be seen in Figure 4, which shows the number of voters enrolled in 150 electorates contested in the 2010 federal election, plotted against the geographical area of the electorate in logarithmic scale. All electorates within the same state or territory are shown with identical markers. The national average enrolment per electorate (93,912 voters) is shown as the dotted horizontal line. By definition, electoral enrolments are clustered around the national mean, but the graph provides insights into several aspects of voter inequality. The comparatively low enrolments for the five Tasmanian electorates reflect the constitutional guarantee of five seats despite a population share that would presently entitle Tasmania to only three. The outlying values for the Australian Capital Territory and the Northern Territory reflect the consequences of rounding electoral entitlements up or down in jurisdictions with a small number of electorates. And the vertical range in data points for a particular state or territory reflects the extent of malapportionment from that jurisdiction’s average enrolment—most evident for Victoria whose electorates varied from 86,220–116,976 voters.
[insert Figure 4 about here]
The spread of electorates by number of voters and area reflects a contemporary system of electoral redistribution that has been substantially refined in comparison with past practices. Until 1974, the permitted variation in the number of voters per electorate was not ±10 per cent but ±20 per cent of the average enrolment for that state. Additionally, until 1983 malapportionment did not automatically trigger redistribution—enrolments in excess of the tolerances resulted in redrawing of electoral boundaries only if the executive consented. As a result, the redistribution processes heralded by malapportionment were routinely delayed or prevented by the intervention of partisan politics. These disruptions (evidenced by the rejection or lapse of 22 recommendations of the Distribution Commissioners under the malapportionment criterion) meant that electorates frequently became highly disproportionate. For example, despite the 1961 Determination declaring the presence of malapportionment in excess of 20 per cent in five of the six states, political opposition stymied every redistribution attempt until 1968. By then the distortion of the value of individual votes was such that the most populous electorate possessed 4.5 times as many voters as the smallest.[55]
Reductions in the permitted range of variation in enrolments is not the only way electoral systems seek to balance the need for demographic responsiveness with the need for stability in electoral boundaries. Shifts in population should not activate the demanding administrative procedures for delimiting new electoral boundaries if the changes are merely ephemeral. Accordingly, Australian electoral law requires a redistribution only if malapportionment exists in at least one-third of the electorates in a state for more than two months. For that purpose, the Electoral Commissioner must make monthly determinations of the deviations from average state enrolments in every electorate. This explains why the electoral system allowed malapportionment in five of Victoria’s 37 electorates in the 2010 election, illustrated by the Victorian outliers in Figure 4.
In addition to the backward-looking calculation of past malapportionment, future population changes must also be taken into account in proposing new electoral boundaries. The Redistribution Committee must calculate projected enrolments for each electorate three and a half years after the redistribution; and it must ensure, as far as practicable, that these enrolments are no more than 3.5 per cent above or below the projected average for that state. The objective of making allowance for anticipated growth or contraction in the number of voters is that electorates should remain well-apportioned not only at the next federal election, but also the one after that, thus giving new electoral boundaries a planned life of at least two parliamentary terms. This goal has not always been achieved in practice—for example, Queensland’s rapid population growth has resulted in redistributions prior to six of the past seven federal elections.
The mechanisms adopted to promote boundary stability account in part for the surprising fact that only one redistribution has been triggered by malapportionment since the tolerance was reduced from ±20 per cent to ±10 per cent in 1974. Eleven of the 12 redistributions triggered by malapportionment occurred while the tolerance was ±20 per cent and the trigger was discretionary. Yet the increased precision of the methodologies adopted by electoral and statistical agencies in making population projections does not alone account for the functional irrelevance of malapportionment in the contemporary Australian electoral system. The ‘passage of time’ trigger, introduced in the 1983 electoral reforms, requires electoral redistribution at least every seven years. Any tendency towards malapportionment that comes with differential rates of population growth over time has been largely outflanked by the ‘passage of time’ trigger itself.
To this point the article has examined the impact of 110 years of population change on electoral redistribution in Australia. It is possible to extend this inquiry to consider the impact of future changes in population size and distribution by using demographic projections. Projections are not predictions or forecasts, ‘but are simply illustrations of the growth and change in population which would occur if certain assumptions about future levels of fertility, mortality, internal migration and overseas migration were to prevail over the projection period’.[56] From the countless permutations of demographic variables, the Australian Bureau of Statistics (ABS) produces three projection series, representing high, medium and low growth scenarios. The medium growth scenario will be used to analyse the impact of changes in population size and distribution on electoral redistribution over the next forty years.
Population growth
The future size of Australia’s population has been the subject of intense public debate, shaped by concerns about the magnitude of the immigration programme and the environmental sustainability of a growing population in an arid continent.[57] The ABS has projected that the estimated resident population will increase to between 30.3 and 40.1 million by 2051 depending on whether high or low growth assumptions are made, with a medium growth projection of 34.4 million.[58]
A substantial increase in the total population may again create pressure to enlarge the legislature, as occurred in 1948 after the federation population had doubled to 7.5 million, and in 1983 after the population had doubled again to 15 million. Under the ABS medium growth projections, the population will double once again to 30 million by 2036. If this is the impetus for further enlargement of the lower house, there will be implications for electoral redistribution.
The minimum legislative enlargement possible under Australian constitutional arrangements is six senators (one for each state, because of the guarantee of equal senatorial representation) and 12 members of the House of Representatives (because of the requirement of a one-to-two ratio between the upper and lower houses).[59] This minimum enlargement was not considered adequate in 1983, when not one but two senators were added to each state, resulting in the addition of 23 lower house members. This approach made it more likely that both major political parties would secure an extra Senate seat and that the balance of power would therefore not be affected by the expansion of the upper house. If we assume the same were to occur in 2036, but that the spatial distribution of the population remained unchanged from 2010, the electoral entitlement of the states and territories would increase as follows—New South Wales +8, Victoria +6, Queensland +5, Western Australia +3, South Australia +2 and Australian Capital Territory +1. This would necessitate redistributions in each of these jurisdictions. Only the Northern Territory and Tasmania would have unaltered entitlements and thus be immune from redistributions on this ground.[60]
Population distribution
The assumption that the spatial distribution of the population will not change between 2010 and 2051 is not realistic. This may happen on a small scale as the population moves between electorates within a state; or on a larger scale as the population shifts between states, thus altering their population shares and their relative electoral entitlements. Anticipating changes of the former kind requires complex small area population projections. Such modelling is done by some states for the purpose of planning and development,[61] but it does not appear to be done for electorates, except to satisfy the statutory requirement to project the number of voters under a proposed redistribution 3.5 years into the future.[62] Long term projections of small populations are difficult to make with accuracy and are beyond the scope of this article.
By contrast, net movements of population between states and territories are projected by the ABS to 2056, based on historic trends over the past 25 years. However, interstate migration—being unrestricted and unregulated—is acknowledged to be ‘the most volatile and consequently least predictable component in any population estimation or projection’ because it is influenced by many factors whose effects cannot be fully anticipated.[63]
The impact of medium growth assumptions on changes in the population shares of the states and territories between 2007 and 2056 has been described by the ABS in the following terms.[64] New South Wales is projected to remain the most populous state, but its share of the total population will decline from 33 per cent to 29 per cent. Queensland is projected to replace Victoria in 2050 as the second most populous state, with Queensland’s share of total population increasing from 20 per cent to 25 per cent, and Victoria’s share decreasing marginally from 25 per cent to 24 per cent. Western Australia will increase its share of Australia’s population from 10 per cent to 12 per cent, while South Australia’s share will decline from 7.5 per cent to 6.2 per cent over the same period. Tasmania’s share will also decline from 2.3 per cent to 1.6 per cent. The population shares of the two territories will remain fairly stable—at 1.1 per cent for the Northern Territory and 1.4 per cent for the Australian Capital Territory in 2056.
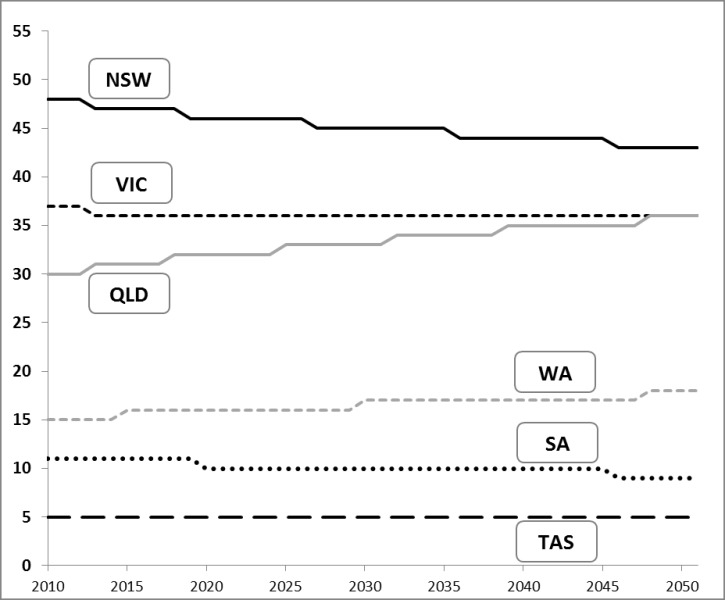
The effect of the changing population shares on the electoral entitlements of the states and territories is determined by the entitlements formula, and is shown in Figure 5. Over the period 2010-2051, changing population shares will trigger 17 redistributions—8 electorates will be lost from New South Wales, Victoria and South Australia, and 9 electorates will be gained in Queensland and Western Australia. The electoral entitlements of the two territories will be unchanged due to their stable population shares, while Tasmania’s entitlement will be unchanged because of its constitutional guarantee of five seats, despite a decline in population share. It is foreseeable that the ascendency of Queensland, in particular, is likely to impact on federal politics in coming years.
[insert Figure 5 about here]
This article has described and analysed two important features of Australian electoral geography, namely, the link between demographic change and electoral redistribution, and the link between electoral redistribution and voter equality. The two features are closely related because population change has provided regular opportunities to redraw electoral boundaries and thus to give expression to evolving conceptions of the ‘one vote, one value’ principle.
Historically, demographic change has been an important driver of electoral redistribution in Australia, accounting for 85 per cent of all federal redistributions since 1901. First, increases in population size have provided the impetus for electoral redistribution through the creation of new lower house electorates. Secondly, for a lower house of a given size, changes in the spatial distribution of the population have affected the electoral entitlement of each state, triggering redistributions as electorates are lost in relatively slow growing jurisdictions and gained in relatively fast growing ones. Thirdly, for a given state electorate entitlement, changes in the spatial distribution of voters within the state have led to malapportionment, triggering redistributions to bring about greater equality in the number of voters per electorate. Prospectively, projected changes in Australia’s population to 2051 will continue to trigger redistributions for the same reasons.
The article also analysed secular changes in voter equality, measured within and between states using two new indices. A central finding is that the federal electoral system has moved progressively towards greater equality of voting power within each state and territory—a trend that has been most pronounced since the electoral reforms of the 1970s and 1980s. However, inequalities of voting power persist between states and territories, especially in less populous jurisdictions.
In view of the inexorable demographic changes that lie ahead, an overarching question is whether Australia’s electoral laws and institutions are well-suited to meeting the population challenges of the next forty years. The basic architecture of the federal electoral system is established by the Constitution, which contains elements of both demographic flexibility and rigidity. On the one hand, the requirement that federal electorates be allocated to each state ‘in proportion to the respective numbers of their people’ creates an imperative to respond to spatial redistribution of the population between states. On the other hand, the guarantee of minimum federal representation for each state irrespective of its population share, and the prohibition on federal electorates crossing the territorial boundaries of the states, constrains the capacity to achieve greater equality of voting power.
However, it is not the Constitution but federal legislation that has had the most significant impact on electoral redistribution and voter equality. Parliament has the power to determine the number of seats in the lower house; the degree of malapportionment that will be tolerated in electorates; the capacity of the executive to initiate redistributions; the frequency of redistributions based on the passage of time; and the representation of the territories. Since the 1970s, Parliament has made significant changes to the institutions and process of electoral redistribution in service to the principle of voter equality. The most important have been the establishment of an independent electoral commission; reduction in executive discretion in initiating redistributions; introduction of mandatory redistribution triggers, and recalibration of those triggers to be more responsive to demographic changes. The combined impact of these changes can be observed in longitudinal data presented above, which show a significant reduction in the extent and variability of malapportionment within each state from the mid-1970s. This legislative framework provides a reasonable basis for navigating projected population changes over the next forty years, although democratic audits show there is still room for debate about how electoral systems can best serve the goal of political equality.[65] Inexorable changes in Australia’s population will demand increasing attention to the impact of demography on electoral boundaries over the coming decades.
APPENDIX
Index of Enrolment Deviation (IED)
For a particular election, the average electoral enrolment is:
[1]
Where:
= average number of voters enrolled in State A
= number of voters enrolled in electorate i in State A
= total number of voters in State A
n = number of single-member electorates in State A
The proportional deviation of voters in each electorate is calculated as follows:
If , then the relative excess of voters is: [2]
If , then the relative shortfall of voters is: [3]
Where:
= proportional deviation from the average number of voters in electorate i in State A
The Index of Enrolment Deviation for State A (IEDA) is the weighted average of the proportional deviations calculated as follows:
, and
[4]
Where:
= proportion of total voters in State A who are enrolled in electorate i.
Index of Population Deviation (IPD)
For a particular election, the electorate share of State within a federation is:
[5]
Where:
proportion of total number of electorates in the federation located in State
= number of electorates in State
= total number of electorates in the federation
= number of States in the federation
The imputed population in State is:
[6]
Where:
the population imputed to State on the basis of its electorate share
total resident population of the federation
resident population of State
The Index of Population Deviation for State () is calculated as follows:
If , then the relative over representation of that State is: [7]
If , then the relative under representation of that State is: [8]
Where:
= proportional deviation between the actual and imputed population in State .
TABLES AND FIGURES
Figure 1: Index of Enrolment Deviation, Australia, 1901-2010
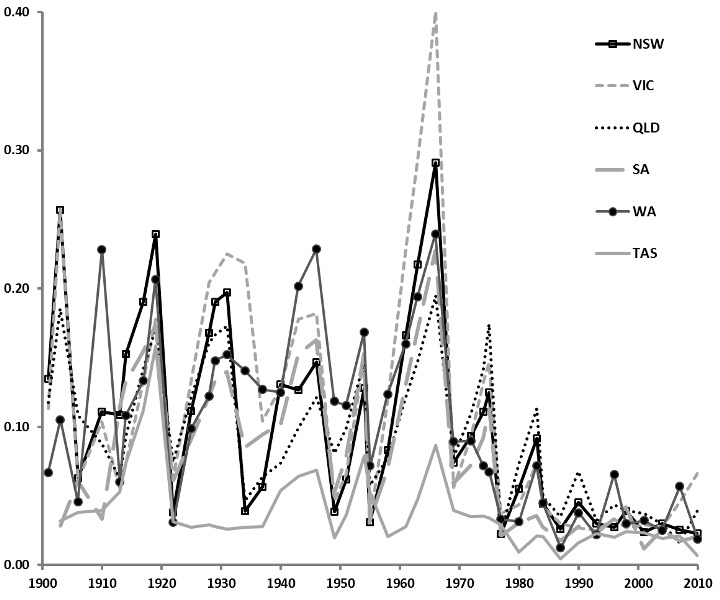
Figure 2: Index of Population Deviation, Australia, 1901-2010
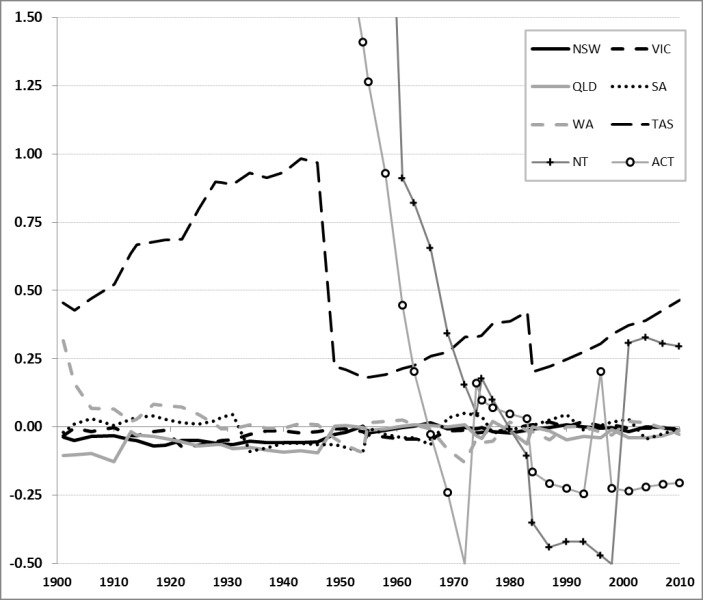
Figure 3: Population and voters per electorate, Australia, 1901–2010
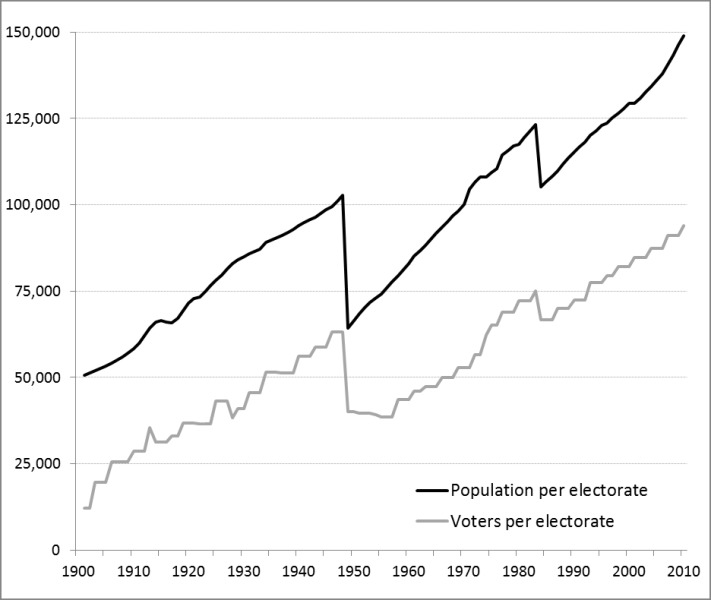
Table 1: Distribution of population and electorates, Australia, 1901 and 2010
|
State or Territory
|
Population
|
Electorates
|
||||
|
|
1901
|
2010
|
Change
|
1901
|
2010
|
2010
(with 1901 pop shares) |
|
|
%
|
%
|
%
|
|
|
|
|
New South Wales
|
35.90
|
32.4
|
–3.6
|
26
|
48
|
52
|
|
Victoria
|
31.8
|
24.8
|
–6.9
|
23
|
37
|
46
|
|
Queensland
|
13.3
|
20.2
|
7.0
|
9
|
30
|
19
|
|
South Australia
|
9.4
|
7.4
|
–2.0
|
7
|
11
|
14
|
|
Western Australia
|
5.0
|
10.3
|
5.3
|
5
|
15
|
7
|
|
Tasmania
|
4.5
|
2.3
|
–2.3
|
5
|
5
|
7
|
|
Northern Territory
|
n.a.
|
1.0
|
0.9
|
n.a.
|
2
|
n.a.
|
|
ACT
|
n.a.
|
1.6
|
1.6
|
n.a.
|
2
|
n.a.
|
|
Total
|
100%
|
100%
|
–
|
75
|
150
|
145
|
|
Population
|
3.79 mill
|
22.41 mill
|
18.62 mill
|
|
|
|
|
Source: ABS, Australian Historical Population Statistics, Cat. No.
3105.0.65.001 (2008); ABS, 3101.0 Australian Demographic Statistics
(2010).
|
||||||
|
Notes: The Northern Territory and the Australian Capital Territory (ACT)
were established in 1911, when they were excised from the
territory of South
Australia and New South Wales, respectively. The last column assumes the
territory populations are again absorbed
into these states.
|
||||||
Figure 4: Number of enrolled voters and area of electorates, Australia, 2010 election
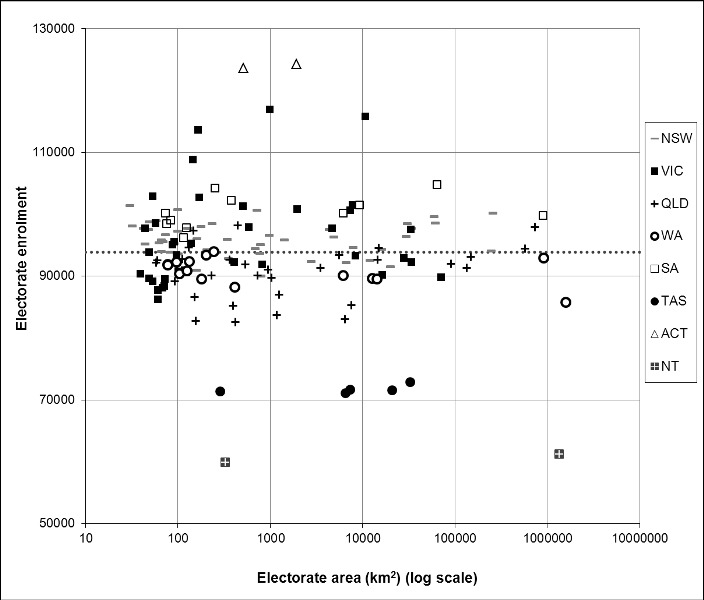
Figure 5: Projected state electoral entitlements, Australia, 2010-2051
[1] R Johnston and Colin Hughes, "Constituency Delimitation and the Unintentional Gerrymander in Brisbane," Australian Geographical Studies 16 (1978).
[2] Australian Bureau of Statistics, "Australian Demographic Statistics, Sep 2010, Cat No. 3101.0," (Canberra: ABS, 2011), Australian Bureau of Statistics, "Australian Historical Population Statistics 2008, Population Size and Growth, Cat No. 3105.0.65.001," (Canberra: 2008), Australian Bureau of Statistics, "Population Projections, Australia, 2006 to 2101, Cat No. 3222.0," (Canberra: ABS, 2008).
[3] Australian Electoral Commission, "Election Results Archive: Virtual Tally Room 2004, 2007, 2010," (Canberra: AEC, 2010), Australian Electoral Commission, "Election Results: Election 2001, Including Behind the Scenes: The 2001 Election Report, Cd-Rom," (Canberra: AEC, 2002), Australian Electoral Commission, "Election Statistics 1987, House of Representatives, Various States and Territories," (Canberra: AEC, 1988), Australian Electoral Commission, "Election Statistics 1990, House of Representatives, Various States and Territories," (Canberra: AEC, 1990), Australian Electoral Commission, "Election Statistics 1993, 1996, 1998, Cd-Rom," (Canberra: AEC, 1999).
[4] Colin Hughes and B.D. Graham, Voting for the Australian House of Representatives 1901-1964 (Canberra: Australian National University Press, 1974), Colin Hughes, Voting for the Australian House of Representatives 1965-1984 (Brisbane: University of Queensland, 1995).
[5] The Constitution (s 7) initially authorised the state of Queensland to create multiple divisions for the purpose of electing its senators. However, this was never done and federal law now prohibits it: Commonwealth Electoral Act 1918 (Cth), s 39.
[6] Attorney General (NSW) ex rel McKellar v Commonwealth (1977) 139 CLR 527, 541, 554.
[7] Commonwealth Electoral Act 1918 (Cth) s 48.
[8] Rod Medew, "Redistribution in Australia: The Importance of One Vote One Value," in Redistricting in Comparative Perspective, ed. Lisa Handley and Bernie Grofman (Oxford: Oxford University Press, 2008).
[9] Colin Hughes, "Institutionalising Electoral Integrity," in Elections: Full, Free & Fair, ed. Marian Sawer (Sydney: Federation Press, 2001).
[10] Orr, The Law of Politics: Elections, Parties and Money in Australia, 55-56.
[11] Productivity Commission, "Population and Migration: Understanding the Numbers," in Commission Research Paper (Canberra: Productivity Commission, 2010).
[12] Graeme Hugo, "The State of Rural Populations," in Sustainability and Change in Rural Australia, ed. C Cocklin and J Dibden (Sydney: UNSW Press, 2005).
[13] D Faulkner, "Spatial Dynamics of Fertility in South Australia, 1976 to 1996" (University of Adelaide, 2005).
[14] Graeme Hugo, "Future Urban Population and Settlement Transitions," in Transitions: Pathways Towards Sustainable Urban Development in Australia, ed. Peter Newton (Collingwood: CSIRO, 2008).
[15] Gordon Carmichael and Peter McDonald, "Fertility Trends and Differentials," in The Transformation of Austalia's Population: 1970-2030, ed. Siew-Ean Khoo and Peter McDonald (Sydney: UNSW Press, 2003).
[16] Australian Bureau of Statistics, "Australian Social Trends, March 2011, Cat No. 4102.0," (Canberra: ABS, 2011).
[17] Donald Rowland, "An Ageing Population: Emergence of a New Stage of Life?," in The Transformation of Australia's Population: 1970-2030, ed. Siew-Ean Khoo and Peter McDonald (Sydney: UNSW Press, 2003).
[18] Australian Electoral Commission, "Election Results Archive: Virtual Tally Room 2004, 2007, 2010."
[19] Graeme Hugo, "Changing Patterns of Population Distribution in Australia," Journal of Population Research and New Zealand Population Review (2002): 1.
[20] Australian Bureau of Statistics, "Australian Social Trends, Population Growth: Past, Present and Future, June 2010, Cat No. 4102.0," (Canberra: 2010).
[21] Department of Sustainability Environment Water Population and Communities, "A Sustainable Population Strategy for Australia: Issues Paper and Appendices," (Canberra: 2010).
[22] Ian Burnley and Peter Murphy, "Change, Continuity or Cycles: The Population Turnaround in New South Wales," Journal of Population Research 19, no. 2 (2002), Ian Burnley and Peter Murphy, Sea Change: Movement from Metropolitan to Arcadian Australia (Sydney: UNSW Press, 2004), Hugo, "Future Urban Population and Settlement Transitions."
[23] There were also four pre-distributions in 1900 in anticipation of the first federal election, and a redistribution is currently underway in South Australia.
[24] Commonwealth Electoral Act 1918 (Cth) s 48A.
[25] Commonwealth Electoral Act 1918 (Cth) s 48(2E), Rosemary Bell and Gerard Newman, "Commonwealth Electoral Amendment (Representation in the House of Representatives) Bill 2004," in Bills Digest (Canberra: Parliamentary Library, 2003-04), Joint Standing Committee on Electoral Matters, "Territorial Representation: Report of the Inquiry into Increasing the Minimum Representation for the Australian Capital Territory and the Northern Territory in the House of Representatives," (Canberra: Australian Parliament, 2003).
[26] Marian Sawer, Norman Abjorensen, and Philip Larkin, Australia: The State of Democracy (Sydney: Federation Press, 2009).
[27] Brian Opeskin, "Constitutions and Populations: How Well Has the Australian Constitution Accommodated a Century of Demographic Change?," Public Law Review 21 (2010).
[28] David Lublin, "Race and Redistricting in the United States: An Overview," in Redistricting in Comparative Perspective, ed. Lisa Handley and Bernie Grofman (Oxford: Oxford University Press, 2008).
[29] Lisa Handley, "Challenging the Norms and Standards of Election Administration: Boundary Delimitation," in Challenging the Norms and Standards of Election Administration, ed. International Foundation for Electoral Systems (2007).
[30] Attorney General (Cth) ex rel McKinlay v Commonwealth [1975] HCA 53; (1975) 135 CLR 1.
[31] European Commission for Democracy Through Law, "Code of Good Practice in Electoral Matters," (Venice: 2002).
[32] Handley, "Challenging the
Norms and Standards of Election Administration: Boundary
Delimitation."
[33] Jonathan
Still, "Political Equality and Election Systems," Ethics 91, no. 3
(1981).
[34] For an analysis, see John Banzhaf, "Weighted Voting Doesn't Work: A Mathematical Analysis," Rutgers Law Review 19 (1965).
[35] Frank Cowell, Measuring Inequality (Oxford: Oxford University Press, 2009).
[36] Paul David and Ralph Eisenberg, Devaluation of the Urban and Suburban Vote (Charlottesville: University of Virginia, 1961).
[37] Manning Dauer and Robert Kelsay, "Unrepresentative States," National Municipal Review 44 (1955).
[38] Colin Hughes, A Handbook of Australian Government and Politics, 1965-1974 (Canberra: Australian National University Press, 1977), Colin Hughes, A Handbook of Australian Government and Politics, 1975-1984 (Canberra: Australian National University Press, 1986).
[39] J Loosemore and V Hanby, "The Theoretical Limits of Maximum Distortion: Some Analytic Expresssions for Electoral Systems," British Journal of Political Science 1 (1971).
[40] David Samuels and Richard Snyder, "The Value of a Vote: Malapportionment in Comparative Perspective," British Journal of Political Science 31 (2001).
[41] ibid.
[42] Australian Electoral Commission, "Australian Federal Redistributions 1901-2003, Research Report No 4," (Canberra: AGPS, 2004).
[43] Commonwealth of Australia, "Parliamentary Debates, House of Representatives, 16 April 1948, 962 (Dr Evatt, Attorney-General)," (Canberra: 1948).
[44] Commonwealth of Australia, "Parliamentary Debates, Senate, 16 November 1983, 2608 (Senator Grimes, Minister for Social Security)," (Canberra: 1983).
[45] This was slightly less than double the number of new senators due to the exigencies of the formula for determining the entitlement of each state to lower house seats.
[46] I Harris, House of Representatives Practice, 5th ed. (Canberra: Australian Parliament, 2005).
[47] A proportionate increase would be represented by a horizontal line in Figure 3.
[48] Robert Dahl and Edward Tufte, Size and Democracy (Stanford: Stanford University Press, 1973).
[49] James Madison, "The Federalist No. 55," in The Federalist, ed. Edward Earle (New York: Random House, 1788), 360.
[50] Hugo, "Future Urban Population and Settlement Transitions.", Burnley and Murphy, Sea Change: Movement from Metropolitan to Arcadian Australia, Department of Sustainability Environment Water Population and Communities, "A Sustainable Population Strategy for Australia: Issues Paper and Appendices."
[51] Australian Bureau of Statistics, "Population Projections, Australia, 2006 to 2101, Cat No. 3222.0."
[52] Commonwealth Electoral Act 1918 (Cth) s 46.
[53] Australian Bureau of Statistics, "Population Estimates: Concepts, Sources and Methods, Cat. No. 3228.0.55.001," (Canberra: ABS, 2009).
[54] Commonwealth Electoral Act 1918 (Cth) ss 66, 73.
[55] Australian Bureau of Statistics, "Drawing House of Representatives Electorate Boundaries, Cat No. 1301.0," (Canberra: 2005).
[56] Australian Bureau of Statistics, "Population Projections, Australia, 2006 to 2101, Cat No. 3222.0," 3.
[57] Barney Foran and Franzi Poldy, "Future Dilemmas: Options to 2050 for Australia's Population, Technology, Resources and Environment," (Canberra: CSIRO, 2002), Peter McDonald and Rebecca Kippen, "Population Futures for Australia: The Policy Alternatives," in Research Paper No. 5 (Canberra: Austrlalian Parliament, 1999), Steve Vizard, Hugh Martin, and Tim Watts, eds., Australia's Population Challenge (Melbourne: Penguin Books, 2003).
[58] Australian Bureau of Statistics, "Population Projections, Australia, 2006 to 2101, Cat No. 3222.0."
[59] Australian Constitution ss 7, 24.
[60] The prospect of future enlargement of the legislative chambers was factored into the design plans of the ‘new’ Australian Parliament. Opened in 1988, it was designed to have capacity to last 200 years: Russell L Cope, "Housing a Legislature: When Architecture and Politics Meet," in For Peace, Order, and Good Government: the Centenary of the Parliament of the Commonwealth of Australia, Papers on Parliament No. 37 (Canberra: Department of the Senate, 2001).
[61] Department of Planning, "New South Wales Statistical Local Area Population Projections, 2006-2036," (Sydney: New South Wales Government, 2010).
[62] Commonwealth Electoral Act 1918 (Cth) ss 63A, 66, 73.
[63] Australian Bureau of Statistics, "Population Projections, Australia, 2006 to 2101, Cat No. 3222.0," 30.
[64] ibid., 51.
[65] See e.g. Graeme Orr, "Australian Electoral Systems: How Well Do They Serve Political Equality?," (Canberra: Australian National University, 2004).
AustLII:
Copyright Policy
|
Disclaimers
|
Privacy Policy
|
Feedback
URL: http://www.austlii.edu.au/au/journals/UTSLRS/2012/1.html