
|
|
Home
| Databases
| WorldLII
| Search
| Feedback
University of Technology Sydney Law Research Series |
Last Updated: 15 February 2017
Title:
The balance of the sexes: the feminisation of Australia’s population, 1901–2008
Keywords:
Australia, life expectancy, migration, mortality, sex differentials, sex ratios
The balance of the sexes: the feminisation of Australia’s population, 1901–2008
ABSTRACT
The numerical balance between males and females in a population has been of long-standing interest to social scientists because of its effects on marriage, fertility and the societal roles of men and women. Yet little attention has been paid to mapping changes in sex ratios or identifying their demographic determinants. This study addresses this gap by examining secular changes in the balance between males and females in Australia from 1901 to 2008. A method of decomposing these changes into components due to sex differentials in fertility, mortality and migration is described and applied.
The study describes the gradual feminisation of the Australian population over a century, and gives an account of how the ratio of the sexes differs by age and how long it takes to exhaust the numerical superiority of males at birth. The study explains these changes by examining long-term trends in the sex ratio of births, deaths and net migration for successive cohorts. The relatively high mortality of males, and the emerging pattern of feminine net migration since the 1970s, explain the transformation of the Australian population from its highly masculine past to its contemporary state of greater balance between the sexes.
INTRODUCTION
The numerical balance between males and females in a population has been a long-standing interest of evolutionary biologists, population mathematicians and medical researchers. For demographers, the balance between the sexes has been an even older topic of inquiry dating at least to John Graunt’s seminal work on the demographic characteristics of seventeenth-century London. Based on more than 270,000 christenings between 1629 and 1661, Graunt noted that there were more male births than female births and gave as the reason for the excess of males ‘that every woman may have a husband’ after allowing for males who are slain in war or drowned at sea, die by the hands of justice, emigrate to foreign lands, or remain unmarried as apprentices or Fellows of Colleges (Graunt 1662; 2001).
In contemporary Australia, social commentators have also remarked on the imbalance between the sexes and have questioned what this might mean for the prospects of long-term relationship formation and social wellbeing. One popular commentator has noted that, while Australian males currently outnumber females age-for-age from birth until their early thirties, from that point on there is a sustained ‘man drought’ as females outnumber males at every subsequent age group, with only a brief reversal in late middle age (Salt 2008). Echoing a similar thesis put forward in the United States a generation before (Novak 1983), Salt suggests that in this type of ‘market’ men can delay committing to marriage and children because there is a relative oversupply of women. The anti-nuptial effect of excess women has been noted by other commentators and is potentially explained by the dyadic disadvantage of the more abundant sex, which is less able to dictate the terms of the relationship (Veevers 2003).
Noting the substantial spatial variations in the ratio of single men to single women aged 30-39 in different cities in Australia (ranging from a six per cent shortfall of men in Brisbane to a 13 per cent excess of men in Darwin), Salt playfully suggests that individuals who seek a relationship may have to act strategically by relocating to a place where competition for a partner is weaker. Other commentators have also noted that regional variations in the balance of males and females can lead to ‘local marriage markets’, such as the relative dominance of males in regions devoted to primary industry and the relative dominance of females in national capitals where government bureaucracies provide attractive employment for women (Veevers 2003).
Salt’s observations about the ‘man drought’ and its precursor, the ‘sheila shortage’, are intended to entertain but they also provoke serious questions for the consideration of social scientists. As Graunt observed in London 350 years ago, it is a near universal phenomenon that more males are born than females. But the male advantage is offset over time because males have higher mortality than females at every age. The ratio of the sexes is thus determined by the balance between the natural processes of birth and death together with any confounding effects of migration.
Jacob Yerushalmy (1943), contemplating the balance between these forces in the United States in the 1940s, posed a range of questions that remain highly relevant today: what will be the resulting ratio of the sexes at each age?; how long will it take for differential mortality by sex to exhaust the numerical superiority of males at birth?; and how large will the numerical superiority of females be at various ages after the point of equality is reached?
This paper re-examines these questions using Australia as a case study. It seeks not only to describe the changing balance between males and females by age and over time but to consider why it has changed. Annual age-specific differences between male and female populations are decomposed into components due to fertility, mortality and migration.
In undertaking this analysis, two features of Australia’s demographic history merit special consideration. While Yerushalmy claimed that the sex ratio in the United States had been negligibly affected by immigration to that time, Australia’s history of convict settlement and robust immigration yields different conclusions. Moreover, Australia has now completed the first demographic transition which, 60 years ago, was still in progress (Booth 2003; Carmichael and McDonald 2003). It is important to consider whether the transformation of a population from a situation of high mortality and fertility to low mortality and fertility has had stable and predictable effects on the numeric balance between the sexes at different ages.
Although this study is confined to describing the patterns and examining the causes of shifting sex ratios, social scientists have shown considerable interest in the effects of such changes on society at large. One early line of inquiry examined the link between unbalanced sex ratios and marriage, noting that the substantial excess of males over females in colonial Australia had profound effects in some periods on the ages and proportions of males and females marrying (McDonald 1974). Many scholars have since investigated the ‘marriage squeeze’—the demographic imbalance between the number of potential brides and grooms, which squeezes some people out of the marriage market (Veevers 2003). They have also examined the effects of sex imbalances on other aspects of family life, including rates of marriage, divorce and fertility, and age preferences of marriage partners (Musham 1974; Pedersen 1991; South and Lloyd 1992; Bhrolcháin 2001). Demographers have simultaneously turned their attention to developing sophisticated measures of partner availability taking into account both quantitative differences in the number of unmarried males and females at different ages and qualitative aspects of partner suitability based on considerations of educational attainment, social class and geographic location (Goldman, Westoff et al. 1984; Veevers 1988; Lampard 1993).
Sociologists have also been interested in the consequences of sex ratios for societal roles of men and women. One seminal theory suggests that ‘sex ratio imbalances produce their effects by disturbing the balance of social power between the two sexes’—the sex in short supply has greater dyadic power to negotiate more favourable terms within the relationship (Guttentag and Secord 1983). This might have significant implications for gender roles, female labour force participation, sexual mores, and family stability (South and Trent 1988; Angrist 2002).
Yet despite keen interest in the consequences of changing sex ratios for social phenomena, scholars have paid relatively little attention to mapping changes in the numeric balance between males and females or in identifying their demographic determinants. This study seeks to fill this gap by examining changes in the balance between males and females in Australia over a period of 108 years from 1901 to 2008.
DATA SOURCES
The data used in this study come from three related sources. The first is the Australian Demographic Databank (ADD) held at the Australian Demographic and Social Research Institute at the Australian National University. Conceived in the 1960s, the ADD is a collection of officially recorded vital statistics and census data which have been ‘cleaned’ to ensure the greatest possible internal consistency between recorded annual flows of demographic events and the stock of population measured at successive censuses. The first version of the databank included data on population, deaths, migration and marital status by sex and single year of age from 1921 to 1976 (Brown and Hall 1978) and a second version carried the data forward over the period 1976–1981 (Krishnamoorthy and Derrick 1983). The current version extends the dataset to 1901–2003 but only for population and deaths (Australian National University 2005). The databank is important for the present study because the annual data comply with the demographic balancing equation and have sufficient refinement to permit analysis by single year of age.
The second source of data is the statistics collected by the Australian Bureau of Statistics (ABS), which are either published online or available commercially. ABS statistics have been used to supplement data on population, births and deaths, 2003–2008. Because the ADD is built on ABS data and is internally consistent with it, it has been possible to use one data source to fill gaps in the other where the need arises.
The third source is the Human Mortality Database maintained by the University of California, Berkeley (USA), and the Max Planck Institute for Demographic Research (Germany). This online database contains annual data on deaths and population by single-year-of-age for Australia, 1921–2007, which are sourced largely from the ADD and the ABS, supplemented by data from the Australian Institute of Health and Welfare.
SEX DIFFERENTIALS AND SEX RATIOS
The simplest way to measure the balance between males and females in a population is to calculate, at a point in time, the absolute difference between the number of females (F) and the number of males (M): a positive value (F–M>0) indicates excess females, and a negative value (F–M<0) excess males. Australia’s estimated resident population (ERP) at 30 June 2008 comprised 10,802,417 females and 10,696,123 males, giving a net excess of 106,294 females for the whole of Australia across all age groups (Australian Bureau of Statistics 2009).
This statistic is more revealing when broken down by single year of age. Figure 1 shows the number of males and females in Australia’s ERP at 30 June 2008. There are excess males for the first 30 years of life, peaking at a net excess of 10,392 males at age 18 years, but from that point the numerical superiority of males declines steadily, passing through the point of balance of the sexes in the early 30s. There are excess females at every age from age 33 to 59 years, a brief reversal at ages 60 to 62, followed by a sustained rise in excess females for all remaining ages, peaking at just over 15,000 at 85 years. As the population dies out at older ages, the absolute difference between the number of females and males narrows once again, reaching zero when there are no survivors.
The number of excess males or females in a population provides a valuable perspective on the balance between the sexes but like other absolute measures it has limited utility because it provides no yardstick for judging whether the number should be considered large or small. To remedy this deficiency a number of relative measures of sex composition can be used which bear simple mathematical relationships to each other (Hobbs 2004).
This study uses the sex ratio, which is often defined as the number of males per 100 females, but which is defined in this paper as the number of males per female, to facilitate the decomposition analysis that follows. When referring to an entire population, this measure will be called the population sex ratio. A population sex ratio of 1.00 indicates the point of numerical balance between the sexes.
It has been empirically observed that the population sex ratio of most countries lies within the narrow range of 0.95–1.02 in the absence of special circumstances such as heavy war losses or heavy net migration, while a ratio below 0.90 or above 1.05 is viewed as extreme (Hobbs 2004).
Figure 2 shows Australia’s population sex ratio from 1901 to 2008. Several aspects of the graph invite comment. The sex ratio has declined markedly, but not steadily, from a high of 1.10 in 1901 to 0.99 in 2008. It was consistently above 1.00 every year until 1978—with the exception of 1917 and 1918—but it has been consistently below 1.00 since 1979, indicating a gradual feminisation of the population. There have also been significant exogenous shocks to this ratio. The first of these spans the years 1915–1919 and covers both the First World War with its large outward male migration and war deaths, as well as the 1918 influenza pandemic with its comparatively high levels of male mortality (Noymer and Garenne 2000). The second shock spans the years of the Second World War (1939–1945). In both cases the relatively rapid improvement in the sex ratio after the shock may signal significant male immigration due to returning soldiers or labour migration programs, which is a matter returned to below. The steady secular decline in the population sex ratio from 1952 to 2008 should also be noted because it signals underlying demographic processes that call for further investigation.
Australia has had a relatively masculine population for much of the period since its establishment as a federation of states in 1901. For 46 of the first 60 years of federation, the sex ratio fell outside the bounds of the suggested normal range of 0.95–1.02, and for 15 of those first 60 years the ratio was extreme (above 1.05) by international standards (Hobbs 2004). Yet these early figures are not an aberration. Data from colonial censuses held during the nineteenth century reveal a highly male-biased population that only gradually attenuated as Australia evolved from an immigrant society into a settled population (Caldwell 1987). The slow decline in the numerical dominance of males can be seen in the falling population sex ratio from 1.42 (1851), to 1.38 (1861), to 1.17 (1881), to 1.16 (1891). By contrast with these colonial data, the population sex ratio of 1.10 that marks the beginning of this study (representing a 10 per cent surplus of males in 1901) appears modest by the standard of Australia’s experience since colonisation, even if aberrant by global standards.
Australia’s current sex ratio should also be seen in comparison with other countries. Globally, population sex ratios vary substantially—from those that are highly feminine such as the Russian Federation (0.86) and the Ukraine (0.86), to those that are highly masculine such as Qatar (3.07) and the United Arab Emirates (2.05). With a ratio of 0.99 in 2008, Australia is more masculine than other countries in its economic grouping of ‘more developed regions’, which averaged 0.94, but somewhat more feminine than the ‘less developed regions’ at 1.03. For the world population as a whole there are 56.3 million more males than females, reflecting a global sex ratio of 1.02 (United Nations Population Division 2009).
AGE-SPECIFIC SEX RATIOS
The sex ratio of a population varies markedly with characteristics such as age, ethnicity, marital status and geographical location, making the population sex ratio merely the balance between many varying and often contradictory influences (Smith and Zopf 1970). Variations in the sex ratio by age are of special importance. This section describes age variations in the Australian sex ratio, while the next section investigates the relative influence of the components of population change.
The extensive data set of Australian sex ratios by age and year, 1921–2008,[1] can be visualised by means of a contour map which plots the three variables, using sex ratios to define the contour intervals. This is shown in Figure 3 using the Lexis 1.1 software developed under the auspices of the Max Planck Institute for Demographic Research (Andreev 1999). The figure takes the form of a Lexis diagram in which time is plotted on the horizontal axis and age on the vertical axis. In this depiction, every birth cohort has a lifeline represented by a diagonal rising to the north-east at 45o. The sex ratio corresponding to each calendar year and single year of age is shown by a pixel whose colour varies according to the six contour intervals identified on the right hand scale—the lighter the colour, the higher the sex ratio, the more masculine the population. The contour intervals are not uniform but have been chosen to reveal important features of the data.
The patterns expressed in Figure 3 are complex because the map summarises the rich history of almost nine decades of population change. If age-specific sex ratios varied according to predictable patterns one would expect to find regular transitions from one contour interval to another as one moved along the lifeline of each birth cohort. This can be seen for the oldest age groups in the top third of the graph, where the contours become progressively darker (more feminine) as the sex ratio falls. For other age groups the patterns are less distinct.
Other features of the graph reveal different aspects of population history. Male mortality in the First World War (1914–18) resulted in continuing low sex ratios for the affected cohorts. This is particularly evident for the cohort aged in their twenties in 1921, with the darker band continuing through to old age. A similar impact is observed for cohorts of an age to serve in the Second World War (1939–45). The light band beginning at age 18 years in 1951 indicates a high sex ratio, which reflects the masculinity of Australia’s immigrant population in the post-war period. The ‘man drought’ postulated by Salt (2008) can be seen as the darker area that has opened up for those above 30 years of age who were born between 1953 and 1975, where the age-specific sex ratios lie between 0.95 and 1.00. By contrast, for cohorts born in the previous 30 years, the sex ratio did not fall below 1.00 until late middle age.
COMPONENTS OF CHANGE
The sex ratio of a population can change only as a result of changes in the sex ratio of the three components of population change: fertility, mortality and net migration. This section examines changes in the sex ratio of these components over time and by age in order to gain a better understanding of the causes underlying the population changes described above.
Sex ratio of births
More has been written on the sex ratio of births than on any other aspect of the sex ratio. It is closely linked with theories of sex determination and has been carefully studied by biologists as an adaptive mechanism of human and animal evolution (Karlin and Lessard 1986). As noted above, among humans more males are routinely born than females, although the extent of the numerical male advantage varies temporally, spatially, and by demographic and other characteristics. Even among non-human mammals, male dominance at birth is extremely common (Clutton-Brock and Iason 1986).
Until recently, births have been the largest annual component of population change in Australia. Their impact is to inject a substantial stream of excess males into the population every year. Australia’s annual sex ratio at birth sits in the standard range of 1.04–1.07 males per female. Figure 4 shows Australia’s sex ratio at birth from 1901 to 2008. The mean ratio for the period was 1.05 male births per female birth, ranging from a low of 1.04 (in 1924) to a high of 1.07 (in 1956). One demographic study of the Australian sex ratio of births found no evidence of a trend over the period 1902–1965 (Pollard 1969). A later study showed a marginal but not significant increase in the ratio between 1921-25 and 1991-95 (Lancaster and Day 1998). In either case, Figure 4 shows a reduction in the variability of the ratio over time.
Australia’s experience differs from the secular trends in sex ratio at birth identified in large scale longitudinal studies of several developed countries. These studies suggest that the sex ratio of births has declined since the 1960s and 1970s in Canada (Allan, Brant et al. 1997), Denmark (Moller 1996), England and Wales (Dickinson and Parker 1996), Japan (Davis, Webster et al. 2007), the United States (among whites but not African Americans) (Marcus, Kiely et al. 1998; Davis, Webster et al. 2007) and more generally in Europe and North America (Grech, Vassallo-Agius et al. 2003). However, this international experience is not universal (Parazzini, La Vecchia et al. 1998), as the Australian data show.
Sex ratio of mortality
It is a near-universal experience—across societies and across time—that males have higher mortality than females. Exactly how much higher depends on the index that is used to measure it (Keyfitz and Golini 1975). Some measures use survivorship by examining the ratio of male-to-female life expectancy at birth; others compare the ratio of age-specific death rates of males and females. Both approaches are discussed below to highlight different aspects of Australia’s experience.
Life expectancy at birth, when based on period data, provides a summary measure of the mortality experience of males and females. Life expectancy in Australia for both sexes increased markedly over the period under consideration. Male life expectancy rose from 52 years in 1901 to 79 years in 2008, while female life expectancy grew from 56 to 84 years.
Figure 4 shows the ratio of male-to-female life expectancy at birth in Australia since the beginning of the twentieth century. For the entire period, female has exceeded male life expectancy, resulting in ratios in the range of 0.91 to 0.96. The ratio fell from a peak in the 1920s, bottoming out in the 1970s, and has been increasing steadily ever since, indicating that male mortality is now falling faster than female mortality. Similar patterns have been observed in other developed countries, including the United States (Rogers, Hummer et al. 2000).
Two explanations have been advanced for observed sex differences in mortality. One explanation is that females are biologically more robust than males (Madigan 1957); the other is that men engage in behaviours that are more damaging to their health (such as smoking, poor diet, and alcohol consumption) and are exposed to greater occupational risks through higher labour-force participation (Wingard 1982). The importance of biology is difficult to refute. Males have higher perinatal and infant mortality than females, long before behavioural differences manifest themselves. Moreover, adjusting mortality for all known behavioural determinants does not account for all the observed sex variation in mortality, suggesting that some part must be due to biology (Verbrugge 1989). Yet biological factors alone cannot explain the secular trends noted above because human biology does not vary at a population level across such short time intervals (Kesteloot 2005). For this reason interest in the behavioural, health and social determinants of sex mortality differentials has remained high (Vallin 1995; Rogers, Hummer et al. 2000).
Sex differences in mortality also show substantial variation by age. A convenient measure of relative mortality by sex is the ratio of male-to-female age-specific death rates (ASDRs) (Pressat 1972; Rowland 2003).
Australia’s historical experience is illustrated in Figure 5, which again uses a Lexis contour plot to show the ratio of male-to-female age-specific death rates in six contour intervals by calendar year and single year of age. The most striking feature of the graph is the double peak pattern of relative mortality seen in the two ‘hot spots’ on the right hand side. This pattern is typical of the experience of many developed countries in the English-speaking world (Lopez 1983). The first peak occurs between ages 17 and 35 years, during which males die at more than two times the rate of females (light area). The intensity of this peak has remained high in recent years and the at-risk ages have widened into the late-30s. The second peak is concentrated between ages 55 and 75 years but it is less intense. The secondary peak has flattened in recent years, suggesting that improvements in female mortality have been smaller than improvements in male mortality in this age group.
Another notable feature of the graph is that very different patterns of relative mortality prevailed in the first half of the twentieth century. In this period the relative mortality of females was often higher than that of males in the 20–40 year age group, which can be seen in the dark areas in the south-west quadrant. These patterns reflect the significant rates of maternal mortality that were experienced during the first few decades of the twentieth century across a woman’s reproductive years (Loudon 1992; Loudon 2000; Lewis 2003). However, from the mid-1930s there was a rapid reduction in deaths from pregnancy and childbirth, which followed improvements in medical and surgical practices and better access to antibiotics. Today, maternal deaths in Australia are rare (Sullivan, Ford et al. 2004).
The patterns of relative mortality by sex have changed over time and epidemiologists have taken a keen interest in examining how behavioural changes in males and females have been reflected in cause-specific death rates. For young males, misadventure and self-harm have been significant causes of death in recent decades (Harrison, Pointer et al. 2009). For example, in 2005 there were 1,309 deaths among Australians aged 15–24 years, with males accounting for 73 per cent of these. The leading cause of death in this age group was injury, with over 70 per cent of deaths caused by motor vehicle accidents and suicide (Australian Institute of Health and Welfare 2008). For older males the mortality disadvantage that first appeared in the 1930s, and strengthened in the 1950s, is thought to be due to men’s early and widespread adoption of smoking, with its concomitant increase in mortality from lung cancer and ischaemic heart disease. Sex differences in mortality in this age group have since begun to fall due to diminishing differences in behaviours that have contributed to men’s higher mortality in the past (Waldron 1993).
Sex ratio of migration
Australia’s population has been shaped by international migration since European settlement in 1788. From the initial waves of convicts, free settlers, and gold rush workers, to current streams of skilled migrant workers, migration has fashioned many key demographic features of the nation, including the balance between the sexes. The masculinity of early migration streams has been well documented and is reflected in the high population sex ratios in colonial censuses from the 1840s (Young 1969; Caldwell 1987). It is often assumed that migration in the twentieth century was also a predominantly male affair but this proposition must be tested against the data.
Unlike many demographic events that reflect relatively stable patterns of human behaviour and biology, annual migration movements are erratic because they are strongly influenced by changing government policies and economic conditions. Australian immigration policy has been likened to a boa constrictor, ‘taking great lumps of new settlers followed by a period of quiescence and digestion’ (Borrie 1994). Since 1901, annual net migration to Australia has been positive in all but a handful of years, and now makes up more than half of annual population growth.
The sex ratio of annual net migration has also been unpredictable (Figure 6). In the early years of the twentieth century, the ratio fluctuated from highs above 5.0 in years of high net male migration, to lows less than zero in years where net migration was positive for one sex and negative for the other. Changes in the sex ratio of annual net migration are the product of complex inward and outward movements characterised by diverse gender patterns that vary by type of migration and over time. These complexities have been more pronounced since the 1990s, as Australia has responded to the globalisation of labour markets through the adoption of new migration streams (Higley and Nieuwenhuysen 2009).
In relation to immigration, for much of the post-war period Australia’s migration program has been characterised by permanent (or settler) migration, which today falls into distinct streams. Three streams—family reunion, skilled migration, and humanitarian migration—are visaed offshore. A fourth stream comprises New Zealand citizens who, since 1973, have enjoyed a liberal migration regime with Australia under the Trans-Tasman Travel Agreement (Carmichael 2009). Trans-Tasman flows have been fairly evenly balanced by gender, but this has not been so with other permanent migration streams. Family reunion migration has been dominated by women, while skilled migration has been dominated by men. Thus, when the family reunion stream has increased relative to the skilled stream, the proportion of females among settler arrivals has also increased. Examining this effect for the period 1991–02 to 2004–05, Khoo, Ho et al (2008: 105-106) noted that the percentage of female arrivals peaked at 55 per cent in 1995–96 when family reunion accounted for 47 per cent of all settler arrivals and skilled migration only 20 per cent. As skilled migration has gained ascendancy over other settler streams in recent years (Khoo, Hugo et al. 2010), the feminising effect of family reunion has been mitigated.
Since the 1990s, permanent migration has been complemented by a dramatic rise in immigration of temporary skilled workers, working holiday makers, and international students. The gender balance of working holiday makers and international students is fairly even, but both have been overshadowed since the mid-1990s by the volume of temporary skilled migrants (Hugo 2009). Khoo, Ho et al (2008) have noted a clear gender dimension in the temporary skilled migration program. For example, in 2000–01, three-quarters of primary applicants were male but two-thirds of dependants who migrated with primary applicants were female. Since primary applicants comprised over half the arrivals in this class, the combined effect of this growing intake has been slightly masculinising.
The rise in emigration from Australia has also been an important trend in recent years. In 2008–09, over 81,000 people departed Australia permanently—double the level of a decade before (Department of Immigration and Citizenship 2010). Overall, about half of all permanent departures are female (Khoo, Ho et al. 2008), but his may change as the proportion of Australian-born departures (which is slightly male-biased) continues to increase.
DECOMPOSING THE POPULATION SEX RATIO BY AGE AND YEAR
The population sex ratio for any age and any year is a product of the sex ratio of births (fertility), the sex ratio of survival (mortality) and the sex ratio of cumulative net migration for the relevant cohort, as shown below.
Assuming that net female migrants experience the same age-specific mortality as the base population, the female population aged x at time t is the sum of the survivors of female births and the survivors of female net migrants:
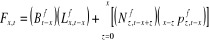 [1]
[1]
where
![]() female population aged x at time t
female population aged x at time t
![]() female births at time t–x
female births at time t–x
![]() probability of surviving to age x for the female
cohort born at t–x
probability of surviving to age x for the female
cohort born at t–x
![]() net female migration aged z at time
t–x+z, who therefore belong to the cohort born
t–x
net female migration aged z at time
t–x+z, who therefore belong to the cohort born
t–x
![]() probability of surviving from age z to age x
for the female cohort born at time t–x
probability of surviving from age z to age x
for the female cohort born at time t–x
The survivors of female net migrants can be expressed as a proportion of the base female population as follows:
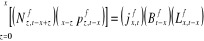 [2]
[2]
where
![]() impact of net female migration on the female population aged x at time
t
impact of net female migration on the female population aged x at time
t
Substituting [2] into [1] and factorising:
![]()
![]() [3]
[3]
By similar derivation the male population aged x at time t can be expressed as:
![]() [4]
[4]
where
![]() male population aged x at time t
male population aged x at time t
![]() male births at time t–x
male births at time t–x
![]() probability of surviving from age 0 to age x for the
male cohort born t–x
probability of surviving from age 0 to age x for the
male cohort born t–x
![]() impact of net male migration on the male population aged
x at time t
impact of net male migration on the male population aged
x at time t
The population sex ratio then becomes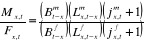
[5]
= (sex ratio of births for cohort t-x) x (sex ratio of survival to age x for cohort t-x) x (sex ratio of impact of net migration at age x and time t).
Unfortunately, Australian migration data are not published by calendar year and single year of age over the period under study. Nevertheless it is possible to estimate the impact of net migration on a birth cohort to age x years as a residual by rearranging equation 5, since all the other terms are known.
The sex ratio of population by age and year, ![]() , was shown in Figure
3, and the annual sex ratio of births,
, was shown in Figure
3, and the annual sex ratio of births, ![]() , in Figure 4. The
cohort survival sex ratio,
, in Figure 4. The
cohort survival sex ratio, ![]() , and the net migration sex ratio,
, and the net migration sex ratio, , are illustrated in Lexis diagrams in Figures 7 and 8.
The survival sex ratio (Figure 7) exhibits much more regular patterning than does the sex ratio of age-specific mortality shown in Figure 5. This is because it demonstrates the cumulative effect for cohorts of mortality sex differentials. The male disadvantage in mortality is evident from the beginning of life, with survival ratios under 1.0 for all cohorts and all ages. However, the relative male disadvantage has lessened over time as mortality has fallen and the mortality sex differential has narrowed.
In terms of the impact of net migration (Figure 8), there are strong cohort effects as net male and female migrants are introduced into the Australian population at particular ages and stay there, subject only to small additions and subtractions due to further migration as the cohort ages. Nearly all the sex ratios of net migration cohort effects lie within the range of 0.9–1.1.
Three features of the graph merit comment. The first is the light area in the middle of the graph between 1951 and 1971 at ages 20–35 years. Net migration was significantly masculine in this period, and the temporal effects of this influx can be seen along the lifelines for those cohorts. The second feature is the parallel band of masculine net migration one generation older, signifying an independent stream of masculine net migration among these earlier birth cohorts. This was due to high male migration to Australia under programmes for the assisted resettlement of British ex-servicemen as farmers and labourers, especially under the Empire Settlement Act 1922 (Richards 2008; Cowell 2009). The third feature is the triangular dark-grey patch on the right hand side opening up from the late 1960s above age 20 years, and within it a black area between 1985 and 2008 above age 25 years. These areas represent the feminisation of net migration, for which there has been no parallel in Australia’s migration history. Because Figure 8 shows net migration effects, the cause of the changes might be found either in larger outflows of male migrants relative to females or smaller inflows of male migrants relative to females. As noted above, the net effects are merely the balance between complex migration streams with different gender dimensions.
The visual similarities between the age/year patterns in the sex ratio of the impact of net migration (Figure 8) and in the sex ratio of the whole population (Figure 3) indicate the importance of migration in shaping the sex ratio at critical periods in Australia’s history. This accords with the findings of a study on the impact of international migration on sex differentials in Australia’s resident population from 1981 to 2003 (Temple 2006). Using the forward survival technique to project the 1980 population into future years, Temple found that most of the deficit of males between ages 20–39 years could be explained by migration patterns: in the absence of migration, the sex ratio of the simulated population was considerably more masculine.
In the current study, we decompose age-specific excess of males or females for each year into components due to sex differentials in fertility, mortality and migration. This decomposition is represented visually in Figure 9 for the year 2008. The black line shows the proportional excess of males or the proportional excess of females at each single year of age, with male excess shown above the horizontal axis and female excess below. This excess is calculated as follows:
If
Mx,t
> Fx,t , then the proportional excess of males =
![]() [6]
[6]
If Fx,t > Mx,t , then the proportional
excess of females = ![]() [7]
[7]
where Mx,t and Fx,t are as previously defined.
The black line showing the relative male or female excess population by age in 2008 corresponds to the data shown in Figure 1 of population by age and sex in 2008. In Figure 1, the male population exceeds the female population from age 0 to age 30 years—Figure 9 shows the proportion by which it does so. In Figure 1, the number of men and women are relatively equal from age 30 years until the late 60s, with females slightly outnumbering males at most ages. Again, Figure 9 shows the proportional excess—this time of females—at these ages (Salt’s (2008) so-called ‘man drought’). From the late 60s, women rapidly gain numerical superiority (Figure 1), exceeding men by more than 20 per cent from the late-70s and more than 50 per cent by the mid-80s (Figure 9).
The stacked bars in Figure 9 show the decomposition of the age-specific male/female population excess into components due to sex differentials in fertility, mortality and migration. These are calculated as follows:
If ![]() , then
, then
the proportional excess of males due to fertility sex differentials =
![]() [8]
[8]
but if ![]() , then
, then
the proportional excess of females due to fertility sex differentials =
![]() [9]
[9]
If ![]() , then
, then
the proportional excess of males due to mortality sex differentials =
 [10]
[10]
but if ![]() , then
, then
the proportional excess of females due to mortality sex differentials =
 [11]
[11]
If ![]() , then
, then
the proportional excess of males due to migration sex differentials =
 [12]
[12]
but if ![]() , then
, then
the proportional excess of females due to migration sex differentials =
 [13]
[13]
where ![]() ,
, ![]() ,
, ![]() ,
, ![]() ,
, ![]() and
and ![]() are all as previously defined.
are all as previously defined.
Technically, these components of fertility, mortality and migration should not be shown as additive as they are in Figure 9, since their transformations are multiplied—not summed—to give age-specific population sex ratios (equation 5). However, in practice the sum of these components (assuming male excess is positive and female excess is negative) comes very close to equalling the value for male/female population excess at each age.
Figure 9 shows the dominance of excess male births in determining age-specific excess male population up until the late teens in Australia in 2008. The slight increase in male excess in the late teens and early twenties is due to male-dominant net migration for the relevant cohorts. These are ages at which flows to Australia of international-students and working-holiday-makers are sizeable. In 2008–09, record numbers of visas were issued in both categories—320,368 of the former and 194,103 of the latter (Department of Immigration and Citizenship 2010).
Male population excess rapidly declines to zero through the late twenties as a result of female-dominant net migration. Through the thirties, forties and fifties, the male and female populations are very close in number, as the female numerical advantage in survivorship and net migration balances the male advantage at birth.
From the early sixties, the net migration advantage swings back to men. This is a continuing effect of heavily male immigration in the post Second World War period for these cohorts. However the male migration advantage is greatly outweighed by the mortality effect. Older women increasingly outnumber their male counterparts in older age due to their higher levels of survivorship (lower cumulative mortality).
Figure 10 shows a similar decomposition to that exhibited in Figure 9, but for ages 10, 30, 50 and 70 years from 1921 to 2008 (vertical scales vary). At age 10 years, as might be expected, the major cause of the consistent male excess of population is the higher number of males born. The proportional excess of males rises over time as the impact of higher male relative to female mortality lessens in successive decades. Sex differentials in net migration have a negligible impact at this age.
At age 30 years, there is a significant excess of males for most of the period due to the male fertility advantage continuing to outweigh the female survival advantage. However the masculine excess fluctuates significantly in line with changes in the cumulative effect of the migration sex ratio. In later years, the male excess is diminished through higher female net migration for these cohorts, with male population excess tipping over to female excess in the late 1990s and early 2000s.
At age 50 years, the effect of fertility (male excess) is almost precisely balanced by the effect of mortality (female excess), with overall male excess population until the late 1990s resulting from higher male net migration for these cohorts. The effect of excess female migration can be seen from around the year 2000, for cohorts born from the mid-twentieth century. This effect for these cohorts is also notable in the chart for age 30 years—where the cohorts born from the mid-twentieth century were aged 30 years from around 1980.
At age 70 years, the mortality effect greatly outweighs both the fertility and net migration effect, leading to an excess of females across the period shown.
In short, Figures 9 and 10 clearly show the persistent effect of excess male births across age for all cohorts, the increasing impact across age of the sex differential in mortality, and the perhaps peculiarly Australian effect of migration sex differentials across age and time.
CONCLUSION
The sex ratio of a population reflects the interplay of complex demographic processes over long periods of time. This study has mapped these changes for Australia over an interval of 108 years. This period has witnessed a feminisation of the population from 1.10 males per female in 1901, to a position of sex ratio equality in the late-1970s, to a preponderance of females, reflected in a population sex ratio of 0.99 males per female in 2008.
Despite this feminising trend, this study has found there is no serious imbalance between the sexes in Australia until older ages. In 2008, male excess population peaked at 7 per cent at ages 18–19 years, and beyond age 30, females outnumbered males by a maximum of 2.7 per cent at age 48years. It is only from the age of the mid-60s that the gap progressively widens as higher male mortality leads to an increasing surplus of women. Significantly, at the median ages for marriage—31.6 years for men and 29.3 years for women in 2007 (Australian Bureau of Statistics 2008)—the numerical balance between the sexes is finely poised. While this paper has not examined the ratio of single men to single women, or other more sophisticated measures of the ‘marriage squeeze’, simple sex ratios often give similar results and serve as an adequate foundation for research (Fossett and Kiecolt 1991). On this basis, the data suggest that genuine concern about a ‘man drought’ in Australia (Salt 2008) is unwarranted.
This study has also described and applied a method for decomposing changes in the population sex ratio into the components due to sex differentials in fertility, mortality and migration. This provides insights into the forces that drive secular changes in the balance of the sexes at different ages and over time.
Until recently, births have been the single most important component of annual population change in Australia. The sex ratio at birth is thus highly significant in determining the sex ratio of the population because it injects a substantial stream of excess males into the population every year. The impact of that injection is long-lived—it dominates other components of change in the sex ratio at younger ages, but the cohort effects can be seen throughout the life course.
The force of mortality is also a significant influence on the sex ratio of a population. It is a near-universal experience that males have higher rates of mortality than females. This has a marked feminising effect on the population, but the strength of this effect varies by age and over time. For a given year, at least in recent times, the cumulative impact of excess male mortality on age-specific sex ratios increases steadily with age, and it is by far the dominant influence on sex ratio of the elderly. Over time, since the 1970s, the differential between male and female mortality in Australia has narrowed to the point where the difference in life expectancies at birth is now at a 60-year low. This has slowed the ongoing process of feminisation, particularly at older ages.
The third component of population change, net migration, has had an erratic impact on the sex ratio of Australia’s population, in keeping with the variability of the migration streams themselves. During the twentieth century, highly masculine migration occurred in the inter-war period and again immediately after the Second World War. These flows have had lasting cohort effects on age-specific sex ratios in later years. However, net migration has also undergone a process of feminisation and since 1970 the sex ratio of net migration has been significantly below parity for those of working age.
Jacob Yerushalmy’s (1943) seminal questions about the sex ratio are now largely answered, but the decomposition analysis in this paper suggests future lines of inquiry that might shed light on the sex composition of different societies at different points in time, past and future. These include a consideration of the long term impact of sex selection at birth on population sex ratios; the effect of sex differentials in mortality in countries at dissimilar stages of the demographic transition; and the influence of large scale gendered migration streams (such as female domestic workers or male construction workers) on the sex composition of sending and receiving countries. While biological processes of fertility and mortality may generate predictable patterns in the sex ratio of these decomposition components, the impact of migration on population sex ratios is likely to be unique to each society.
REFERENCES
Allan, B., R. Brant, et al. (1997). "Declining sex ratios in Canada." Canadian Medical Association Journal 156(1): 37-41.
Andreev, K. (1999). Demographic Surfaces: Estimation, Assessment and Presentation, with Application to Danish Mortality 1835-1995. Centre for Health and Social Policy. Denmark, University of Southern Denmark,. PhD.
Angrist, J. (2002). "How do sex ratios affect marriage and labour markets? Evidence from America's second generation." Quarterly Journal of Economics 117(3): 997-1038.
Australian Bureau of Statistics (2008). Marriages, Australia, 2007, Catalogue No. 3306.0.55.001. Canberra, Australian Bureau of Statistics.
Australian Bureau of Statistics (2009). Australian Demographic Statistics, Catalogue No. 3101.0. Canberra, Australian Bureau of Statistics.
Australian Institute of Health and Welfare (2008). Australia's Health 2008, Cat no. AUS 99. Canberra, AIHW. Cat no. AUS 99.
Australian National University (2005). Australian Demographic Databank, version 3.2b. Canberra, Australian National University.
Bhrolcháin, M. (2001). "Flexibility in the marriage market." Population: An English Selection 13(2): 9-47.
Booth, H. (2003). The changing dimensions of mortality. The Transformation of Australia's Population 1970-2030. S.-E. Khoo and P. McDonald. Sydney, UNSW Press: 104-128.
Borrie, W. (1994). The European Peopling of Australasia: A Demographic History 1788-1988. Canberra, Australian National University.
Brown, H. and A. Hall (1978). Australian Demographic Databank: Volume I Recorded Vital Statistics 1921-1976. Canberra, Australian National University.
Caldwell, J. (1987). Population. Australians: Historical Statistics. W. Vamplew. Sydney, Fairfax, Syme & Weldon Associates.
Campbell, R. (2001). "John Graunt, John Arbuthnott, and the human sex ratio." Human Biology 73(4): 605-610.
Carmichael, G. (2009). "A History of Population Movement between New Zealand and Australia." International Migration 31(4): 513-560.
Carmichael, G. and P. McDonald (2003). Fertility trends and differentials. The Transformation of Australia's Population 1970-2030. S.-E. Khoo and P. McDonald. Sydney, UNSW Press: 40-76.
Clutton-Brock, T. and G. Iason (1986). "Sex ratio variation in mammals." Quarterly Review of Biology 61(3): 339-374.
Cowell, F. (2009). Measuring Inequality. Oxford, Oxford University Press.
Davis, D., P. Webster, et al. (2007). "Declines in sex ratio at birth and fetal deaths in Japan, and in US whites but not African Americans." Environmental Health Perspectives 115(6): 941-946.
Department of Immigration and Citizenship (2010). Population Flows: Immigration Aspects 2008-2009. Canberra, Australian Government.
Dickinson, H. and L. Parker (1996). "Why is the sex ratio falling in England and Wales?" Journal of Epidemiology and Community Health 50(2): 227-228.
Fossett, M. and K. Kiecolt (1991). "A Methodological Review of the Sex Ratio: Alternatives for Comparative Research." Journal of Marriage and Family 53(4): 941-957.
Goldman, N., C. Westoff, et al. (1984). "Demography of the marriage market in the United States." Population Index 50(1): 5-25.
Graunt, J. (1662). Natural and Political Observations Made upon the Bills of Mortality.
Grech, V., P. Vassallo-Agius, et al. (2003). "Secular trends in sex ratios at birth in North America and Europe over the second half of the 20th century." Journal of Epidemiology and Community Health 57: 612-615.
Guttentag, M. and P. Secord (1983). Too Many Women? The Sex Ratio Question. Beverly Hills, Sage Publications.
Harrison, J., S. Pointer, et al. (2009). A Review of Suicide Statistics in Australia. Injury Research and Statistics Series No. 49. Canberra, Australian Institute of Health and Welfare.
Higley, J. and J. Nieuwenhuysen (2009). Introduction. Nations of Immigrants: Australia and the USA Compared. J. Higley, J. Nieuwenhuysen and S. Neerup. Cheltenham, Edward Elgar: 1-21.
Hobbs, F. (2004). Age and sex composition. The Methods and Materials of Demography. J. Siegel and D. Swanson. San Diego, Elsevier Academic Press: 125-173.
Hugo, G. (2009). Flows of Immigrants 1993-2008: Australia. Nations of Immigrants: Australia and the USA Compared. J. Higley, J. Nieuwenhuysen and S. Neerup. Cheltenham, Edward Elgar: 22-41.
Karlin, S. and S. Lessard (1986). Theoretical Studies on Sex Ratio Evolution. Princeton, Princeton University Press.
Kesteloot, H. (2005). "On the sex ratio of mortality: evolution during the period 1970-1999." Acta Cardiologica 60(1): 1-6.
Keyfitz, N. and A. Golini (1975). "Mortality comparisons: the male-female ratio." Genus 31: 1-34.
Khoo, S.-E., E. Ho, et al. (2008). Gendered Migration in Oceania: Trends, Policies and Outcomes. New Perspectives on Gender and Migration: Livelihood, Rights and Entitlements. N. Piper. New York, Routledge: 101-136.
Khoo, S.-E., G. Hugo, et al. (2010). "Skilled migration from Europe to Australia." Population, Space and Place.
Krishnamoorthy, S. and B. Derrick (1983). Australian Demographic Databank: Volume III Recorded Vital Statistics, Population Estimates and Demographic Rates 1976-1981. Canberra, Australian National University.
Lampard, R. (1993). "Availability of marriage partners in England and Wales: a comparison of three measures." Journal of Biosocial Science 25(3): 333-350.
Lancaster, P. and P. Day (1998). "Declines in population sex ratios at birth." Journal of the American Medical Association 280(13): 1139-1140.
Lewis, M. (2003). The People's Health: Public Health in Australia 1788-1950. Westport, Praeger.
Lopez, A. (1983). The sex mortality differential in developed countries. Sex Differentials in Mortality: Trends, Determinants and Consequences. A. Lopez and L. Ruzicka. Canberra, Australian National University: 53-120.
Loudon, I. (1992). Death in Childbirth: An International Study of Maternal Care and Maternal Mortality 1800-1950. Oxford, Clarendon Press.
Loudon, I. (2000). "Maternal mortality in the past and its relevance to developing countries today." American Journal of Clinical Nutrition 72(suppl): 241S-246S.
Madigan, F. (1957). "Are sex mortality differentials biologically caused?" Milbank Memorial Fund Quarterly 35(2): 202-223.
Marcus, M., J. Kiely, et al. (1998). "Changing sex ratio in the United States, 1969-1995." Fertility and Sterility 70(2): 270-273.
McDonald, P. (1974). Marriage in Australia: Age at First Marriage and Proportions Marrying, 1860-1971. Canberra, Australian National University.
Moller, H. (1996). "Change in male:female ratio among newborn infants in Denmark." Lancet 348: 828-829.
Musham, H. (1974). "The Marriage Squeeze." Demography 11(2): 291-299.
Novak, W. (1983). The Great American Man Shortage and Other Roadblocks to Romance. New York, Rawson Associates.
Noymer, A. and M. Garenne (2000). "The 1918 influenza epidemic's effects on sex differentials in mortality in the United States." Population and Development Review 26(3): 565-581.
Parazzini, F., C. La Vecchia, et al. (1998). "Trends in male:female ratio among newborn infants in 29 countries from five continents." Human Reproduction 13(5): 1394-1396.
Pedersen, F. (1991). "Secular trends in human sex ratios: their influence on individual and family behaviour." Human Nature 2(3): 271-291.
Pollard, G. (1969). "Factors influencing the sex ratio at birth in Australia 1902-65." Journal of Biosocial Science 1: 125-144.
Pressat, R. (1972). Demographic Analysis: Methods, Results, Applications. Chicago, Aldine Atherton.
Richards, E. (2008). Destination Australia: Migration to Australia Since 1901. Sydney, UNSW Press.
Rogers, R., R. Hummer, et al. (2000). Living and Dying in the USA: Behavioral, Health, and Social Differentials of Adult Mortality. San Diego, Academic press.
Rowland, D. (2003). Demographic Methods and Concepts. Oxford, Oxford University Press.
Salt, B. (2008). Man Drought and other Social Issues of the New Century. Melbourne, Hardie Grant.
Smith, T. and P. Zopf (1970). Demography: Principles and Methods. Philadelphia, F.A. Davis Company.
South, S. and K. Lloyd (1992). "Marriage opportunities and family formation: further implications of imbalanced sex ratios." Journal of Marriage and the Family 54(2): 440-451.
South, S. and K. Trent (1988). "Sex ratios and women's roles: a cross-national analysis." American Journal of Sociology 93(5): 1096-1115.
Sullivan, E., J. Ford, et al. (2004). "Maternal mortality in Australia, 1973-1996." Australian and New Zealand Journal of Obstetrics and Gynaecology 44: 452-457.
Temple, J. (2006). Decomposing Historical Gender Differentials in ERP Data: What Has Been the Effect of International Migration and Changing Mortality? Canberra, Australian National University.
United Nations Population Division (2009). World Population Prospects: The 2008 Revision (online data). New York, United Nations.
Vallin, J. (1995). Can sex differentials in mortality be explained by socio-economic mortality differentials? Adult Mortality in Developed Countries: From Description to Explanation. A. Lopez, G. Caselli and T. Valkonen. Oxford, Clarendon Press: 179-200.
Veevers, J. (1988). "The 'real' marriage squeeze: mate selection, mortality, and the mating gradient." Sociological Perspectives 31(2): 169-189.
Veevers, J. (2003). Marriage Squeeze. International Encyclopedia of Marriage and Family. J. Ponzetti. New York, Macmillan Reference USA. 3: 1107-1113.
Verbrugge, L. (1989). "The twain meet: empirical explanations of sex differences in health and mortality." Journal of Health and Social Behaviour 30(3): 282-304.
Waldron, I. (1993). "Recent trends in sex mortality ratios for adults in developed countries." Social Science and Medicine 36(4): 451-462.
Wingard, D. (1982). "The sex differential in mortality rates: demographic and behavioral factors." American Journal of Epidemiology 115(2): 205-216.
Yerushalmy, J. (1943). "The age-sex composition of the population resulting from natality and mortality conditions." Milbank Memorial Fund Quarterly 21(1): 37-63.
Young, C. (1969). An Analysis of the Population
Growth and Mortality of Selected Birth Cohorts in Australia, with Reference to
the
Relationship between Cohort and Transverse (or Calendar Year) Experience.
Research School of Social Sciences. Canberra, Australian National
University. PhD.
[1] Single-year-of-age sex ratios for 1901-1920 are not shown because there are problems with population data for this period in the ADD. The ADD is the only available source for single-year-of-age population data for this period.
AustLII:
Copyright Policy
|
Disclaimers
|
Privacy Policy
|
Feedback
URL: http://www.austlii.edu.au/au/journals/UTSLRS/2012/4.html