
|
|
Home
| Databases
| WorldLII
| Search
| Feedback
University of Technology Sydney Law Research Series |
Last Updated: 15 February 2017
The State of the Judicature:
A Statistical Profile of Australian Courts and Judges
Professor Brian Opeskin
(brian.opeskin@mq.edu.au)
Macquarie
University
ABSTRACT
In 1977 Chief Justice Barwick gave one of the first statistical snapshots of the Australian courts as a ‘judicial system’ in his inaugural ‘State of the Australian Judicature’ address. Since then, there has been no detailed statistical examination of the characteristics of the Australian judicature, due in part to the paucity of reliable data. After the passage of 36 years, this article provides a second examination of Australian courts and judges using data from the Productivity Commission and other sources. The article describes and analyses key attributes and observable trends in the judicature from the perspectives of both the supply side (judicial labour) and the demand side (court lodgements). This is done across six domains—size and growth; tiers of the court hierarchy; state versus federal systems; civil versus criminal subject matter; regional dynamics; and gender composition. What emerges is a complex picture of a dynamic judicial system that does not always comport with common assumptions about its structure and organisation. There is a critical need for the collection of additional data on the judicature, and for research that provides a better understanding of the forces that will shape the evolution of the Australian judicial system over the coming decades.
ACKNOWLEDGEMENTS
Chris Prestipino provided valuable research assistance for this project. I would also like to thank Justice Roslyn Atkinson, Rebecca Kippen, Sir Anthony Mason, Denise Meyerson, Cheryl Saunders, James Stellios, Fiona Wheeler and the anonymous referees for their insightful comments.
1. INTRODUCTION
In 1977 Chief Justice Barwick gave an inaugural address to the Australian Legal Convention on ‘The State of the Australian Judicature’, a practice that was followed at the biennial conference with few exceptions until the Conventions were abandoned in 2009 (see Appendix). The address was intended as both an account of the distinctive features of the Australian judicial system and a call for reform in areas needing correction or development. Impressively for the times, the Chief Justice sought to include statistical information on Australian courts, including the number of judicial officers and the caseload of the courts, by jurisdiction and level of court hierarchy. The appendices to the address provide one of the first statistical snapshots of Australian courts as a ‘judicial system’.
The content of successive ‘State of the Australian Judicature’ addresses has generally failed to live up to its ‘grandiloquent title’ and its implicit promise of a broad survey of the Australian judicial system. Chief Justice Barwick’s successor, Sir Harry Gibbs, stated that he had no responsibility for the work of courts other than his own, and denied he had the knowledge and experience to make a useful survey of the state of the entire judicature. In keeping with this more modest ambition, Chief Justice Gibbs’ statistical contribution was confined to presenting data on the workload of the High Court of Australia. Since Chief Justice Barwick’s inaugural address, no ‘State of the Australian Judicature’ address has sought to provide detailed information about Australian courts and judges—rather each has showcased a variety of substantive issues affecting the judiciary, including judicial independence, workload and resources, cost and delays, and recruitment and retention of judges. The closest others have come to Barwick’s account are the summary statistics provided by Chief Justice Gleeson in five successive addresses, in which he gave the total number of judicial officers and their division by state or federal court (see Section 3 below).
Chief Justice Barwick’s tantalising glimpse into Australian courts prompts us to ask what we might understand about the courts as a system if more information were available for the purpose of description, analysis and prediction. Assumptions are often made about the nature of the judicial system based on received wisdom or personal experience, but do these reliably reflect the judicial system as it functions today? This article seeks to address this question using data that have been reported for some years now but which have not been systematically explored or analysed. The data permit the question to be examined from two different but complementary perspectives. On the demand side, one can examine the number of cases that are lodged in the courts for resolution; on the supply side one can examine the number of judicial officers (judges and magistrates) who are engaged to hear and determine those cases. This article focusses on data about judicial officers as a means of understanding the characteristics of the judicial system as a whole, but demand-side data are also discussed where there are significant variations in the two perspectives.
The article is largely descriptive because description is the key to a better understanding of the judicial system, and is also a critical omission in existing scholarship. However, description leads naturally to questions about why observed patterns exist, and these analytical perspectives lead in turn to questions about why the system has evolved in particular ways and where it may be headed. The article considers these larger questions, but there is a need for further research and reflection on possible futures of the Australian judicial system.
Attributes of Australian courts and judges are examined here across six domains, which are discussed in successive sections. These are: size and growth (Section 3); tiers of the court hierarchy (Section 4); state versus federal judicial systems (Section 5); civil versus criminal subject matter (Section 6); regional dynamics (Section 7); and gender composition (Section 8). This choice has been driven primarily by the availability of data and does not reflect the totality of attributes that merit consideration in principle. First, however, it is necessary to consider the sources of data on the Australian judicature and their inherent limitations.
2. IN SEARCH OF DATA
Compiling data on the Australian court system was a difficult task in 1977, even for a Chief Justice assisted by court officers from around the country. Barwick’s caseload statistics completely omitted some jurisdictions (the territories) and the lowest tier of the judicial hierarchy (magistrates courts), and a large number of figures were simply unavailable even for courts that were intended to be included within his survey. These difficulties prompted Barwick to remark that ‘[n]o statistics of a like kind are kept on an Australia-wide basis’, and to make, as his first recommendation for reform, the suggestion that the Australian Statistician take up the challenge of maintaining wide-ranging data on the operation of Australian courts.
That recommendation has not been heeded. Although we are better served today than 36 years ago, there are still substantial gaps in the collection and dissemination of data about courts and judges. The most significant problems concern depth (data is limited to a small range of variables), breadth (data is confined to specific courts or states), duration (long time series are not available), consistency (changing definitions of what is being counted), and access (older data are only available from archives by special request, if at all). In combination, these problems can make it difficult to obtain comprehensive, reliable and timely data on the judicial system as a whole, which in turn makes it hard to plan for the future.
Data on Australian courts and judges today come from a variety of public and private sources, each with its own limitations. The most important source of public data on the Australian court system—and the one principally relied on in this article—is the Productivity Commission, which has collected and disseminated information since 1995 on the effectiveness and efficiency of government-funded social services. Its annual ‘Report on Government Services’ (ROGS) has a chapter on courts, which includes statistics on civil and criminal lodgements and finalisations by state and court. Since 2003, ROGS has also included information on the number of judicial officers by state and court, categorised by time spent on civil and criminal work, thus allowing a ten-year time span to be examined for the first time. ROGS data expressly exclude the operations of the High Court and all federal, state and territory tribunals.
The ROGS data go some way to meeting Chief Justice Barwick’s call for the collection of wide-ranging data on the operation of Australian courts but they also have limitations particularly with respect to depth, duration and consistency. Some useful variables are not recorded (e.g. gender of judicial officers), several data series span only a decade, and the copious footnotes to the tables indicate numerous differences between jurisdictions in the way data are collected. Every year brings changes to the counting methodology in one state or another, and while this has resulted in improvements in the quality of the data over time, it can make inter-temporal and inter-jurisdictional comparisons misleading. The Productivity Commission has itself described the process as ‘one of continual improvement and refinement, with the long term aim of developing a national data collection that covers court activities across the Australian, State and Territory jurisdictions in a timely and comparable way’. ROGS thus provides a snapshot of the contemporary characteristics of the Australian judicial system and an indication of some recent trends but is not capable of identifying all relevant transformations in the judicial system.
There have been considerable refinements to ROGS over the years but it has remained vulnerable to criticisms about the uses to which the data are put. Two former Chief Justices of Australia, Sir Anthony Mason and Murray Gleeson, have commented that no satisfactory indicator of judicial productivity has yet been devised and have warned about using such indicators to draw inappropriate conclusions. In similar vein, a former Chief Justice of New South Wales, Jim Spigelman, has remarked that ‘the most important aspects of the work of the courts are qualitative and cannot be measured’, not even by proxy indicators. These key qualities include values of accessibility, openness, fairness, impartiality, legitimacy, participation, honesty and rationality. This judicial hostility to measures of judicial productivity (i.e. the rate at which ‘inputs’ of judicial time are converted to ‘outputs’ of finalised disputes) has not dampened the enthusiasm of the Productivity Commission for reporting on measures of performance. These include measures of equity (eg fees paid by applicants, number of judicial officers), effectiveness (eg backlog), and efficiency (eg clearance rates, judicial officers per finalisation, staff per finalisation). This article does not canvass issues of judicial performance, thus allowing these issues to be put aside for present purposes. Other jurisdictions, particularly in the United States, are much further advanced in utilising ‘weighted caseload’ as a measure of individual and institutional judicial performance. But whether in that guise or another, calls for comparative measures of judicial performance become increasingly hard to resist in an age of transparency and accountability.
Apart from ROGS, other public sources of data on courts and judges include annual reports, official web sites, and data compiled and published by specialised research institutes, such as the gender statistics collected by the Australasian Institute of Judicial Administration. Annual reports—which most courts have been required to produce since the late 1980s or early 1990s—hold particular promise because they are usually tabled in Parliament and thus readily accessible. Nevertheless, their utility is compromised by their limited jurisdictional coverage and the highly aggregated nature of the reported data.
Mention should also be made of privately held data on courts and judges. One such source is empirical survey data collected to answer specific research questions, such as the national survey of Australian magistrates and the national survey of Australian judges undertaken by Kathy Mack and Sharon Roach Anleu. These are valuable data collections with sound coverage of the relevant populations, although the survey data were not available to the author for the purpose of this study. Such collections are rare in Australia because judges are regarded as a difficult population to survey due to their ‘high status, professional remoteness, time constraints, assumed resentment or reticence to participate, and concerns about the confidentiality of responses’. In addition, the author holds data on a number of Australian courts, obtained through the good offices of heads of jurisdiction. These data are not comprehensive but nevertheless provide useful examples of courts operating at different levels within the court hierarchy. In this article, all data is sourced from ROGS unless otherwise indicated.
3. SIZE AND GROWTH
Over the past 36 years, the Australian judiciary has witnessed significant growth. According to Chief Justice Barwick, on 31 December 1976 there were 587 judicial officers in Australia, across all jurisdictions and all levels of the court hierarchy. Of these, 50 per cent were magistrates, 21 per cent were judges of intermediate courts (predominantly district and county courts), and the remaining 29 per cent were judges of supreme courts. Viewed from a jurisdictional perspective, 85 per cent of judicial officers belonged to state courts, 6 per cent to territorial courts, and 9 per cent to the federal courts (whose ranks had recently been swelled by the establishment of the Family Court of Australia). In later ‘State of the Australian Judicature’ addresses, Chief Justice Gleeson indicated that there were 889 judicial officers in 1999, 976 in 2001, 939 in 2003, 956 in 2005, and 957 in 2007. A growing proportion of these were federal judicial officers, whose ranks rose from 12.3 per cent of all Australian judicial officers in 1999 to 14.6 per cent in 2007.
Since 2003, the Productivity Commission has also published data on the number of ‘judicial officers’, defined as ‘judges, magistrates, masters, coroners, judicial registrars and all other officers who, following argument and giving of evidence, make enforceable orders of the court’. The ROGS data are not strictly comparable to Barwick or Gleeson’s figures because they are collected on a full-time equivalent (FTE) basis, which makes allowance for part-time and acting judicial appointments. Although Barwick’s ‘head count’ does not do this, significant discrepancies are unlikely because the practice of appointing part-time or acting judges was uncommon in the 1970s. At 30 June 2012 there were 1,081.5 FTE judicial officers in Australia—an 84 per cent increase since 1976, and a 10.1 per cent increase in the ten years since the ROGS data were first collected. This is illustrated in Figure 1 using indices in which 2003 is the base year (index=100).
Figure 1: Indices of judicial officers, Australian residents per judicial officer, and lodgements, 2003–2012.
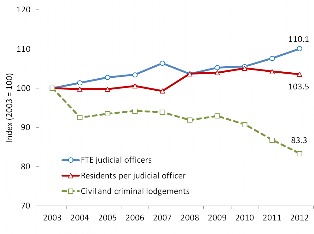
Sources: ROGS (various years); Australian Bureau of Statistics, Cat No 3101.0
The growth in the number of judicial officers stands in contrast to the demand-side data: the number of civil and criminal cases lodged in Australian courts actually fell by 16.7 per cent over the ten year period, from 1.761 million in 2003 (index=100) to 1.468 million in 2012 (index=83.3). There are several possible explanations for this trend. There may be fewer civil and criminal disputes in society overall; larger numbers of disputes might remain unresolved (signalling declining access to justice); or disputes might be resolved increasingly outside the formal court system, such as through alternative dispute resolution mechanisms or criminal diversionary programmes. One consequence of these alternative mechanisms, supported anecdotally, is that the judicial system now has to adjudicate a higher proportion of complex and time-consuming cases, which may help to reconcile the apparent paradox of declining lodgements but rising judicial appointments. The declining caseload of Australian courts has not been felt uniformly across civil and criminal matters, which is an issue discussed in greater detail in Section 6 below.
The Australian population has grown substantially over this interval due to natural increase (births minus deaths) and net international migration. Has the growth in the number of judicial officers kept pace with the growth in the population? In 2003 there were 20,264 Australian residents for every judicial officer (index=100); by 2012 this had deteriorated by 3.5 per cent to 20,982 residents per judicial officer (index=103.5), as shown in Figure 1. This suggests that in recent times the growth in the number of judicial officers has not kept pace with the growth in population. This is significant because, as the Productivity Commission has noted, this ratio can be seen as one measure of the community’s access to the judicial system. Yet over the longer term the opposite is true: between 1977 and 2007 there was a 90 per cent increase in the number of judicial officers compared with a 45 per cent increase in population.
It is not possible to draw conclusions from these ratios about the adequacy of the stock of judges in serving the population’s legal needs, nor from the fact that in 1976 the ratio appeared less favourable—there were then 24,038 residents per judicial officer. Much will depend on the level of legal disputation in the community, the extent to which disputes are resolved outside the court system, and the productivity of judicial officers in determining the cases that come before them. This raises systemic issues about the nature and extent of the community’s legal needs, and the role of the formal justice sector in meeting those needs. Despite efforts in some jurisdictions to assess the public’s legal needs, there is a paucity of empirical research into the demand-side of civil justice in Australia.
4. THE RISE OF LOWER COURTS
Every first year law student is inculcated with the view that the Australian court system is a hierarchy in which magistrates courts form the lowest tier, district or county courts the intermediate tier, and supreme courts the upper tier, with the High Court of Australia sitting as the ‘keystone of the federal arch’. The metaphor used to depict this architecture is the pyramid, with its suggestion of a large and solid base that tapers gradually to its summit. The existence of federal courts complicates the picture, but they are accommodated in the metaphor by incorporating the Federal Court and Family Court into the supreme court tier, and the Federal Circuit Court (previously called the Federal Magistrates Court) into the magistrates court tier. In this conception, the courts are often thought of in ascending order of importance—from the bottom of the court hierarchy to the top—reflecting the increasing law-making function as one progresses from intermediate to higher appellate courts.
The reality of the court system is rather different. As noted, in 2012 there were 1,081.5 FTE judicial officers in Australia. The majority of these (53.2 per cent) held commissions in magistrates courts, but the next largest tier was not the district courts (which accounted for 19.5 per cent of judicial officers) but the supreme courts, with a 27.4 per cent share (see Figure 2). Thus, viewed from the perspective of judicial labour, the Australian court system is more an hourglass than a pyramid. However, the national picture is complicated by the fact that not all jurisdictions have a three-tiered court hierarchy. For those that do, the conventional metaphor of the pyramid is generally an accurate one: the magistrates court is larger than the district court, which is larger than the supreme court. Once account is taken of the absence of an intermediate-level court in three small jurisdictions (Tasmania, Australian Capital Territory, and Northern Territory) and in the much larger federal jurisdiction, this ranking is changed and the supreme courts gain numerical ascendancy over the district courts on an Australia-wide basis.
Figure 2: Distribution of judicial officers and lodgements by level of court hierarchy, 2012.
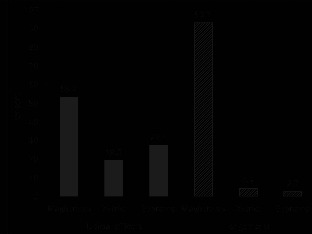
Source: ROGS (2013)
The demand side paints a more conventional picture, but with a twist. In 2012, 93.1 per cent of all civil and criminal cases lodged in Australian courts were commenced in the magistrates courts, with only 4.3 per cent commenced in the district courts and 2.7 per cent in the supreme courts (see Figure 2). This conforms to the pyramid metaphor, but the pyramid is one with an extraordinarily wide base and a low apex. By this measure, the lower courts are overwhelmingly the most important in the hierarchy for ‘[t]hey are the only courts that the vast majority of people are likely to have to face’. As far back as 1977, Chief Justice Barwick stated (with reference to the growth in district and county courts) that this ‘is a tendency to be encouraged’, as increasing the workload of the lower courts lessened the workload of the higher courts and the demands on the senior ranks of the profession. This patrician attitude has been challenged, however, by Chief Justice Gleeson’s observation that, whatever the interests of higher courts, ‘[i]t is upon the magistrates’ courts that we depend principally for our ability to make justice accessible to ordinary people.’
This description gives a snapshot at a point in time, but the temporal trends provide a valuable insight into the evolution of the judicial system. Since 2003, the number of FTE judicial officers in Australia has grown by 99.7 persons (10.1 per cent) but this overall growth masks important shifts between tiers of the court hierarchy. The only tier to have experienced significant positive growth over this period is the magistrates courts, which increased by 90.1 persons (18.6 per cent). By contrast, the number of supreme court judges grew by only 2.0 per cent, and district court judges by 1.8 per cent, over the decade.
The reasons for the relative rise of lower courts are not difficult to find. First, there are constraints on the expansion of the upper tiers of the court hierarchy, particularly in the final court of appeal. The High Court of Australia has had seven justices for over one hundred years, in part because the development of a coherent body of jurisprudence is not assisted by having a larger appellate body that sits in panels. As Chief Justice Mason has commented, ‘an increase in our numbers is unlikely to add significantly to our work capacity ... and it may add to our difficulty in achieving a consensus’. Similarly, the Supreme Courts of Canada and the United States comprise only nine justices, and the Supreme Court of the United Kingdom twelve justices, despite national populations that are substantially larger than Australia’s.
Secondly, there are pressures that tend to push cases to the lower tiers of the hierarchy. The demand for better access to justice suggests that a principle of ‘subsidiarity’ ought to apply to the court system, whereby matters are devolved to the lowest level consistent with the just determination of the dispute. This can promote access to justice by reducing economic barriers to dispute resolution, facilitating physical access to the courts, and minimising delays to hearing and determination. Chief Justice Gleeson has spoken about this devolution of jurisdiction as a time-honoured method of shifting a backlog of cases to the lower courts, where matters can be disposed of more quickly and less expensively, although the problems of further burdening the resource-constrained lower courts should not be ignored. Public finance considerations also put pressure on the Executive to contain the growth in the number of superior court judges: not only do they command higher salaries and larger staff, but their non-contributory pension arrangements impose long term costs that do not exist when commissioning judicial officers to the lowest tier of the hierarchy. Governments are sometimes explicit about this. In its 2009 strategic framework for improving access to justice in the federal civil justice system, the Commonwealth Attorney-General’s Department commented that ‘Cost is a factor in assessing both the demand and supply aspects of access to justice. ... Where possible, matters should be directed to the least cost option that produces a fair outcome.’ The report went on to compare the net cost of providing a unit ‘service’ in 2007–08, which was $1,484 in the Federal Magistrates Court (now the Federal Circuit Court), $8,817 in the Family Court and $17,590 in the Federal Court.
Many mechanisms can be used to achieve this goal. In civil cases, monetary limits on the jurisdiction of lower and intermediate courts encourage smaller cases to be commenced lower in the hierarchy, reinforced by cost penalties if a plaintiff selects a higher court. In criminal cases, there has been an enormous expansion in the range of offences that can be determined in magistrates courts, either as summary offences or indictable offences that can be tried summarily. The downward classification of formerly indictable offences triable by judge and jury into the domain of magistrates has been justified by concerns about efficiency and apprehension over expense and delays associated with higher court justice.
Thirdly, magistrates courts have become more appropriate vehicles for receiving this expanded jurisdiction, possibly in response to the new demands made of them. They have shed their historical roots as courts constituted by non-remunerated lay persons to the point where the modern Australian magistrate ‘is a judge in all but name’. Increasingly, magistrates courts are professional institutions staffed by judicial officers with higher qualifications, greater legal experience and better access to continuing legal education than earlier incarnations—a metamorphosis that has been documented by many writers, even if the changes are incomplete.
5. THE RISE OF FEDERAL COURTS
One of the most remarkable transformations of the Australian judicial system in the twentieth century was the expansion of the federal courts. The High Court, established in 1903, was the first federal court. In the decades following federation, Parliament chose not to create a full and separate system of federal courts, such as existed in the United States, but rather to confer federal jurisdiction on state courts—a choice that has been memorably described as an ‘autochthonous expedient’. Over the years, exceptions were made in specialised areas: the Commonwealth Court of Conciliation and Arbitration was established in 1904, the Federal Bankruptcy Court in 1930, and the Commonwealth Industrial Court (later renamed the Australian Industrial Court) in 1956. However, major change did not arrive until the Family Court was established in 1975 and the Federal Court in 1976. In 1999 the Federal Magistrates Court was added to provide a lower tier in the federal judicial hierarchy, and renamed the Federal Circuit Court of Australia in April 2013.
There are various explanations for the change in attitude towards the creation of new federal courts and the conferral of jurisdiction on them. One consideration was that a federal court with national operation could attain uniformity in the interpretation and development of federal law, which state courts interpreting the same laws could not achieve as readily. This was the view of Chief Justice Barwick at the time of the Federal Court’s creation, and a major reason for his advocacy for a larger appellate role for the Federal Court. Another consideration was that conferring federal jurisdiction on federal courts enabled judges to develop specialist expertise regarding the subject areas entrusted to them, for example in the area of family law. A third consideration was based on political accountability. In the words of Prime Minister Gough Whitlam, ‘[j]udges who are called on to interpret and apply statutes should be appointed by governments responsible to the parliaments which passed those statutes’—a view that came to be supported many years later by a powerfully constituted advisory committee to the bicentennial Constitutional Commission. However, speaking critically of the Federal Court’s creation in his 1981 ‘State of the Australian Judicature’ address, Chief Justice Gibbs rejected this view, stating that ‘it is in truth a rejection of the principle of judicial independence to suggest that only judges appointed by the Commonwealth should administer Commonwealth laws. A final consideration in the creation of additional federal courts was the pragmatic one of lightening the workload of the High Court, whose original jurisdiction had become quite burdensome.
The creation of new federal courts did not pass without disparagement from some quarters. Chief Justice Gibbs controversially remarked in 1985 that the creation of the Family Court was a mistake because the limited scope and emotionally exhausting nature of its jurisdiction made it difficult to maintain the highest standards in judicial appointment. Nevertheless, once the process of federalisation had begun, it developed its own momentum—the more that federal jurisdiction was conferred on federal courts, the more appropriate it seemed to confer further jurisdiction on those courts. This led to a rapid increase in the size of the federal judiciary, which is illustrated in Figure 3 using three data sources: ROGS data (2003–2012), court annual reports, and data obtained from heads of jurisdiction on file with the author. The Federal Court and the Family Court grew steadily in their early years but levelled off at around 45–50 judges by the early 1990s for the Family Court, and by the late 1990s for the Federal Court. The Federal Circuit Court grew even more rapidly in its first decade, increasing from just 10 magistrates in 2000 to 62.4 FTE magistrates in 2012, and only recently has its rapid expansion slowed. Because one of the main objectives of establishing the Federal Circuit Court was to determine less complex family law matters, the growth in the size of that Court has come at the expense of the Family Court, which has steadily declined in size for a decade. Throughout this period, the High Court retained its long standing complement of seven justices.
Figure 3: Number of judicial officers in the federal courts, 1976–2012.
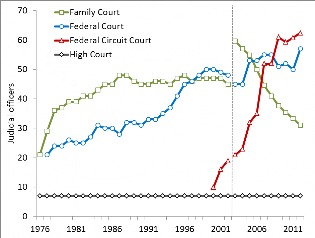
Sources: ROGS (various years); Federal Circuit Court, annual reports; Court data on file with author.
Figure 3 illustrates patterns in the development of the federal judicial system—rapid early growth, stabilisation, and changing relativities between the courts—but says nothing about the relationship between federal courts and state courts. This was a matter of some delicacy in the 1970s and 1980s, as state court judges became concerned about the erosion of the jurisdiction and status of their courts at the hands of the federal legislature. The extent to which the federal courts grew at the expense of the state courts in those years is a matter of conjecture. In 1981, Chief Justice Gibbs expressed his belief that the federal courts had unnecessarily taken away jurisdiction that would otherwise have been conferred on state supreme courts. In some fields there was a transfer of discrete subject matter from state courts to federal courts, such as occurred with bankruptcy law in 1930 and family law in 1975. In other fields the new federal jurisdiction reflected novel government regulation of social and economic activity, such as the consumer protection laws that arrived with the Trade Practices Act 1974 (Cth). Federal expansion in these fields did not occur by carving existing jurisdiction out of the state court systems although, as noted, the supreme courts would otherwise have been a natural repository of such new jurisdiction.
It is worth recalling that the distribution of workload between state and federal courts is not coextensive with the distribution of state and federal jurisdiction. Federal courts can generally only exercise federal jurisdiction, but state courts can exercise both state jurisdiction and such federal jurisdiction as is conferred on them. The conceptual basis of jurisdiction exercised in a particular case can be difficult to determine. For example, an action brought in a state court between residents of different states is a federal claim, even if based on a common law cause of action; while a matter within state jurisdiction may be converted unexpectedly into a federal one if a federal element arises in the course of litigation. Data on the relative importance of state and federal jurisdiction are thus impossible to obtain—all that can be said with confidence is that the number of federal judicial officers and the number of lodgements in federal courts underestimate the true importance of federal jurisdiction in the Australian judicial system because some federal jurisdiction is exercised by state courts.
The changing relationship between the state and federal courts in more recent years is better understood using ROGS data. On the supply side, the federal courts represented 13.9 per cent of all Australian judicial officers in 2012, and hence they are a numerically small (but qualitatively important) part of the Australian court system. The demand side data confirms this: the federal courts represented just 7.9 per cent of all Australian lodgements in 2012. However, the statistical balance between the state and federal court systems has been volatile. On the supply side, the size of the federal judiciary increased by 19.6 per cent between 2003 and 2012, compared with only 8.7 per cent growth in the states and territories. On the demand side, federal lodgements decreased by 10.5 per cent between 2003 and 2012, compared with a 17.2 per cent decline in lodgements in the states and territories.
Thus it can be seen that the federal courts have enjoyed relatively faster growth in personnel than state and territory courts, while the decline in their caseload has been tempered in comparison with the states and territories. A possible explanation for the apparent paradox between expanding judiciaries and shrinking civil caseloads has been noted above, namely, the loss of simpler cases to alternative dispute resolution mechanisms and hence the concentration of longer, more complex cases in the courts. This may also provide an explanation for the differential experience of federal and state courts: complex cases might be accumulated in federal courts more rapidly than in state courts. However, empirical evidence does not provide strong support for the hypothesis of greater complexity. In surveys of judicial officers conducted in 2007, 67 per cent of magistrates and 50 per cent of judges considered that their judicial functions had increased since their appointment, yet only 10 per cent of responding magistrates and 11 per cent of responding judges gave increased complexity as a reason for the increase.
6. STRATIFICATION BY SUBJECT MATTER
Since their inception, Australian courts have had authority to determine both civil and criminal matters. Although enforcement of criminal law was the most pressing function of courts in the first years of European settlement, a civil court operated in New South Wales from 1788 to deal with the developing trading economy of the new colony. In recent years, the rise of civil and administrative penalties has blurred the boundaries to a degree, but the distinction between civil and criminal jurisdiction remains central to the administration of justice. Differences in substantive law, as well as in curial procedure, rules of evidence and remedies, have encouraged the specialisation of legal practitioners and judicial officers in civil or criminal fields. Structurally, this is reflected in the organisation of many courts. The Victorian Supreme Court, for example, has three trial divisions (Criminal, Common Law, and Commercial/Equity), while the New South Wales Supreme Court makes a distinction at the appellate level, with a separately constituted Court of Appeal and Court of Criminal Appeal, albeit with overlapping judicial membership.
This part considers three questions, namely, the relative importance of civil and criminal jurisdiction in the architecture of the legal system; the way in which that relationship has changed over time; and differences in the civil–criminal balance at different levels of the court hierarchy. As with previous topics, the questions can be viewed from a supply-side or demand-side perspective. Analysis of the supply side is assisted by ROGS data that enumerate FTE judicial officers by the proportion of their time allocated to civil and criminal work.
Whether by coincidence or design, judicial time is allocated to civil and criminal matters in approximately equal measure across the entire court system. In 2012, 52.6 per cent of FTE judicial officers were allocated to criminal matters and 47.4 per cent to civil matters. Data on lodgements offers an identical picture—52.7 per cent of all Australian lodgements were criminal matters and 47.3 per cent were civil matters, reinforcing the equal importance of each field to the system as a whole.
Temporal changes in these relationships have been modest. On the supply side, the proportion of judicial time allocated to civil matters and criminal matters has changed little as the judiciary has grown over the past ten years, fluctuating between a low of 49.9 per cent criminal work (2005) to a high of 54.1 per cent criminal work (2009). Yet closer analysis suggests a more subtle picture. Between 2003 and 2012 there was a net addition to the Australian judiciary of 99.7 FTE judicial officers, and 64.8 per cent of this net gain was in the criminal area, reflecting the fact that the growth in judicial labour allocated to crime was nearly double the growth in judicial labour allocated to civil matters.
On the demand side, as noted in Section 3, there was a 16.7 per cent decline in the total number of cases lodged in Australian courts between 2003 and 2012 (a reduction of nearly 294,000 cases). This decrease has not been borne equally in civil and criminal matters: 70 per cent of the reduction occurred in civil matters and only 30 per cent in criminal matters. The reasons for the reduction are different in each case. In relation to criminal matters, data compiled by the Australian Institute of Criminology indicate that there has been a substantial decline in the number of crimes recorded by police over the past decade, and this naturally flows through to the number of criminal matters lodged in the courts. In the decade 2001–2010, the total number of crimes recorded across eight major crime categories fell by 36 per cent. The decline was most pronounced for property crimes, where the reduction was as much as 61 per cent in one category (motor vehicle theft), while the statistics for violent crimes were more variable, ranging from a decline of 45 per cent in robbery to an increase of 12 per cent in assault. Explanations for the decline in the level of crime in Australia, as in many other industrialised countries, must be sought in the criminology literature, where there is little consensus, but the implications of the decline for the courts seem clear.
In relation to civil matters, it is tempting to conclude that alternative dispute resolution (ADR) mechanisms have provided a growing number of alternatives to litigation in civil cases. The move towards ADR has been fuelled by the pull factors of speed and informality, but also by the push factor of cost. In his 1989 ‘State of the Judicature’ address, Chief Justice Mason lamented that substantial fees for the use of court facilities were driving litigants to commercial arbitration, leading to separate public and private systems of justice, and potential difficulty in recruiting judges. Yet it is difficult to be categorical about the role of ADR in explaining the decline in civil lodgements. In 2009, the National Alternative Dispute Resolution Advisory Council (NADRAC) noted in a report to the Commonwealth Attorney-General that ‘there is very little empirical data available about the provision and use of ADR’ outside the family law arena, and this made it ‘impossible to get a clear picture of the interaction between ADR and other civil justice services, including litigation’.
In addition, the tort law reforms that occurred in most Australian jurisdictions between 2002 and 2004, following the Ipp Review, caused a substantial decline in personal injury litigation. The largest relative declines in claiming rates before and after the Ipp Review have been reported for Victoria (–82 per cent), Queensland (–71 per cent) and New South Wales (–63 per cent), with the reductions concentrated at the district court rather than the supreme court level. The net result is that criminal matters form a growing majority of cases in the Australian judicial system.
However, this description masks significant stratification between courts in the balance between civil and criminal work. In 2012, judges of state and territory supreme courts allocated 31.9 per cent of their time to criminal work, but judicial officers in the district courts and magistrates courts allocated more than twice this to criminal work (68.2 per cent and 70.1 per cent, respectively). Figure 4 shows how this proportion has changed over time. Notably, the proportion of criminal work in the district courts rose steadily from 59.4 per cent in 2003 to 71.9 per cent in 2011 before declining slightly the following year. These figures indicate that Australian supreme courts are predominantly civil courts, while district courts and magistrates courts are predominantly criminal courts.
Figure 4: Proportion of judicial time allocated to criminal work by level of court hierarchy, 2003–2012.
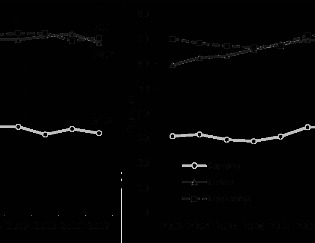
Source: ROGS (various years).
7. REGIONAL DYNAMICS
In addition to the macro-level changes across the whole judicial system, it is relevant to consider differences between the courts of the various states and territories. There are significant regional differences in population size, population growth rates and levels of economic activity, and these can have far-reaching implications for courts. Three examples illustrate the point. First, population size has a bearing on court structure—it is no coincidence that the least populous jurisdictions (Tasmania, Australian Capital Territory, and Northern Territory) have a two-tiered rather than a three-tiered hierarchy, with no district court. Secondly, population size can impact on the type of matters determined in the courts—large commercial centres might spawn more civil and commercial work, while large urban concentrations might give rise to more crime. Thirdly, a jurisdiction whose population (and hence judiciary) is growing slowly has less capacity to alter the composition of its courts through new appointments than a jurisdiction whose judiciary is expanding rapidly.
The spatial distribution of Australia’s population has changed significantly over time, making it ‘one of the most dynamic and policy-relevant dimensions of the nation’s contemporary demography’. These changes occur slowly but their cumulative impact can be large. As Australia’s population has grown six-fold since federation, the share of the population in the south-eastern states has steadily lessened. Between 1901 and 2012, the population share of four states (New South Wales, Victoria, South Australia and Tasmania) declined, while the population share of Queensland and Western Australia increased. As a consequence, Western Australia overtook South Australia in 1982 as the fourth most populous state, and it is projected that Queensland will overtake Victoria in 2051 as the second most populous state.
The long term implications of these regional population trends are likely to be significant for state and territory courts. However, ROGS data are unlikely to reveal significant temporal trends because of the short interval for which the data are available (i.e. 2003–2012). Table 1 compares the absolute number of FTE judicial officers in each state and territory in 2003 and 2012, as well as the share of the judiciary attributable to each state and territory in those years. The Table omits the federal judiciary, and hence the figures differ from those discussed in Section 3.
Table 1: Judicial officers by state and territory, 2003 and 2012.
|
Jurisdiction
|
Number (FTE)
|
|
Share of Judiciary (%)
|
||||
|
2003
|
2012
|
Change
|
|
2003
|
2012
|
Change
|
|
|
NSW
|
272.3
|
270.4
|
–1.9
|
|
31.8
|
29.1
|
–2.8
|
|
VIC
|
212.0
|
241.4
|
29.4
|
|
24.8
|
25.9
|
1.2
|
|
QLD
|
129.1
|
152.8
|
23.7
|
|
15.1
|
16.4
|
1.3
|
|
WA
|
112.3
|
131.1
|
18.8
|
|
13.1
|
14.1
|
1.0
|
|
SA
|
75.3
|
76.5
|
1.2
|
|
8.8
|
8.2
|
–0.6
|
|
TAS
|
18.8
|
20.2
|
1.4
|
|
2.2
|
2.2
|
0.0
|
|
ACT
|
14.1
|
12.7
|
–1.4
|
|
1.6
|
1.4
|
–0.3
|
|
NT
|
22.2
|
25.6
|
3.4
|
|
2.6
|
2.8
|
0.2
|
|
Total
|
856.1
|
930.7
|
74.6
|
|
100.0
|
100.0
|
0.0
|
Source: ROGS (various years).
All jurisdictions experienced growth in the absolute number of FTE judicial officers between 2003 and 2012, except New South Wales and the Australian Capital Territory, where there were modest absolute declines (–1.9 and –1.4 FTE officers, respectively). An examination of the relative shares of each state and territory shows that New South Wales and Victoria have the largest judiciaries, accounting for over half of all state and territory judicial officers, followed by Queensland and Western Australia. Demand-side data on lodgements reveals the same regional patterns. However, these patterns have not been static. New South Wales experienced a decline in its share of judicial officers of 2.8 percentage points (from 31.8 to 29.1 per cent). The change in the shares of other jurisdictions was small but the period in question is too short to discern any long term trends.
One issue on which there is significant regional variation is the relationship between the size of the population and the size of the judiciary, which can be seen by examining the average number of residents ‘serviced’ by a judicial officer in each state or territory. As noted above, this is regarded as a potential measure of access to the judicial system. Figure 5 shows marked differences in the level of servicing, although there are no clear time trends. In 2012, the average across all states and territories was 24,369 residents per judicial officer, but jurisdictions ranged from the Northern Territory, which was 62 per cent better serviced than the average (9,173 residents per judicial officer), to Queensland, which was 22 per cent more poorly serviced (29,843 residents per judicial officer).
Further research is needed to explain why judicial staffing is relatively high in jurisdictions like the Northern Territory and relatively low in others like Queensland. Potential explanations include the size and geography of the state or territory, the civil–criminal case mix, the nature of criminal and civil actions lodged, the court level case mix, and the productivity of judges and magistrates. For example, the Northern Territory is a geographically large jurisdiction with many remote Indigenous communities. It also has one of the highest proportions of criminal case load—in 2012, 68.1 per cent of all lodgements in the Territory were criminal, compared with a national average of 57.2 per cent. These considerations may go some way to explaining the judicial staffing levels, although the Northern Territory is not unique in these respects.
Figure 5: Number of residents per judicial officer by jurisdiction, 2003–2012.
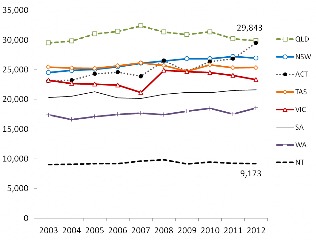
Sources: ROGS (various years); Australian Bureau of Statistics, Cat No 3101.0
8. WOMEN IN THE JUDICIARY
One of the fundamental transformations that has taken place in the Australian judiciary is the change in its gender composition. Judicial office has long been a male-dominated profession, the product of ‘discriminatory, systematic and structural practices in the legal profession’ that prevent female advocates from receiving the same opportunities as male advocates. It is not intended to address here the very rich literature on women and the judiciary, but rather to present key data that can inform our understanding of this important transformation.
Although Australia’s first female judge (Dame Roma Mitchell) was appointed to the Supreme Court of South Australia in 1965, nearly 50 years ago, significant inroads have been made only in the past two decades. Women now comprise well more than half those who graduate from law schools, but only about one-third of all Australian judicial officers are female, which is reasonably similar to the experience in Canada, the United Kingdom and the United States. In 2012, the highest concentrations of female judicial officers were found in the Australian Capital Territory (45.5 per cent) and Victoria (38.3 per cent), and the lowest concentrations in Tasmania (25 per cent) and South Australia (26.9 per cent).
Gender statistics compiled by the Australasian Institute of Judicial Administration (AIJA) show changes in the gender composition of the Australian judiciary both across time (since 2000) and by level of the court hierarchy. Figure 6 illustrates this using the sex ratio (i.e. the number of males per 100 females), which is a standard demographic measure of the gender composition of a population: a ratio greater than 100 indicates a predominance of males, while a ratio less than 100 indicates a predominance of females. The gender balance of the judiciary has changed significantly over time. In 2000, there were 480.6 male judicial officers for every 100 female judicial officers, but by 2012 this had improved to 205.0 males for every 100 females. Nevertheless, there is a significant distance to travel in achieving gender parity—there are still more than twice as many males as females in the judiciary.
Figure 6: Sex ratio of judicial officers by level of court hierarchy, 2000–2012.
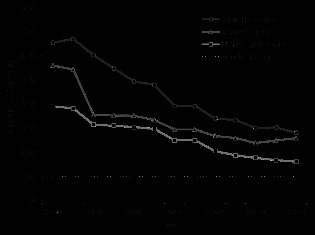
Source: Australasian Institute of Judicial Administration.
There have been improvements in gender balance at all levels of the court hierarchy, but there are also sizable differences in sex ratios by court level (Figure 6). Male dominance increases with the status of the court, and thus the greatest gender imbalances are generally found in the higher courts. In 2012, the number of male judicial officers per 100 female judicial officers was 281.2 for Australian supreme courts (including the High Court, Federal Court and Family Court), and 259.0 for district courts, but only 161.6 for magistrates courts.
Different explanations have been given for the gender stratification by court level. One possibility is that the appointments process is more gender biased at the higher levels. This is consistent with the ‘glass ceiling’ hypothesis, namely, that invisible barriers block the upward movement of women to senior professional ranks. The claim is not merely that there is a persistent gender gap in authority, but that this disadvantage intensifies as one progresses up an organisational hierarchy. On this view, fairer and more transparent appointments processes will redress the representational bottleneck. The apparent lack of women at the district court level may also reflect women moving at a faster rate from that court into higher courts, just as the paucity of women among the senior ranks of the Bar may be a natural consequence of the elevation of female silks to the Bench. An alternative explanation, proposed by Mack and Roach Anleu, is that different factors attract men and women into different positions within the judiciary. Their national survey of judges revealed that ‘value to society’, ‘hours’, and ‘opportunity for career enhancement’ were more important reasons for becoming a judge or magistrate for women than for men at each court level. Women may thus be more likely to see a judicial appointment at any level as a positive move, while men may require a higher level appointment to justify the perceived sacrifices associated with appointment to the Bench.
Even within a court level, there can be significant differences between the states and territories, leading one to contemplate the nature of the barriers that have made some jurisdictions more resistant to change. Among the district courts, for example, the sex ratio in 2012 varied from 153.8 in Victoria to 633.3 in South Australia, making the latter the most male-dominated court in the country, with more than six times as many males as females. Conversely, particular courts stand out has having moved closer to gender parity than others: in 2012 the sex ratio was lower than 150 males per 100 females in the High Court, the Family Court, and in the magistrates courts in New South Wales, Victoria and the Australian Capital Territory.
The data just described focusses on the gender composition of the stock of judicial officers at a point in time. The sex ratio of a court, or a group of courts, will reflect historical discriminatory practices because courts comprise individuals appointed at different points in time over long intervals. However, the proportion of women in the judiciary is unlikely to change rapidly if the pool of existing judicial officers is large and the annual turnover is small. It would be revealing to examine the gender composition of the flow of individuals into and out of the judiciary, since the characteristics of the stock of judicial officers simply reflect the accumulated experience of annual increments and decrements. In particular, it would be valuable for future research to investigate trends in the gender composition of annual judicial appointments, for only this permits an assessment of the present-day appointment practices of the Executive.
The focus in this part on the gender of the judiciary should not be taken to indicate that sex is necessarily the only demographic variable to have undergone transformation in recent years. The age structure of the judiciary is also a matter of considerable interest—reflecting changes in the age patterns of entry and exit, both recent and past. The age of appointment is affected by the time required to attain the educational qualifications and practical experience necessary for the effective performance of judicial functions, and by the manner in which the Executive exercises its discretion in selecting appointees. The age of exit is affected by death rates, mandatory retirement ages, and the incentives for resignation that arise from pension and superannuation arrangements. In addition to age, the ethnicity, ancestry and country of birth of judicial officers are also matters of interest. Australia has one of the highest percentages of foreign born inhabitants of any country in the world, and it would be valuable to know the extent to which the diversity of immigration is reflected in the composition of the judicial workforce. There is little public data on these issues—none of it in the ROGS data analysed in this study—and it remains a worksite for future research.
9. CONCLUSION
By 2056, Australia’s population is projected to grow to 35.47 million—an increase of 55 per cent on the estimated resident population in January 2013. What might the judicature look like in that environment, nearly 45 years hence? There are different approaches to answering this type of question. Futurologists often speculate boldly about futures that look very different from the present, rejecting the common assumption that what lies ahead will be a ‘steady growth’ extension of the past. Radical visions for the future include the complete transformation of the court system through technologies that enable humans to transcend their biological limitations. In a world of artificial intelligence, the process of legal reasoning might be automated, making judges and courts redundant.
While it is thought-provoking to speculate about distant futures, this article does not traverse that path. Instead, it opts for the modest goal of documenting what we reliably know about the evolution of the Australian judicial system in the relatively recent past. Over the short to medium term it is likely that the courts of tomorrow will be related to the courts of today through a process of incremental adaptation or evolution. Over the longer term such assumptions become less reliable. Nevertheless, a better understanding of past trends is important in evaluating more speculative futures. In the business world, ‘scenario planning’ is an emerging methodology designed to provide a framework for speculation about the future. It seeks to overcome the usual errors in decision-making (over-confidence and tunnel vision) by helping planners to recognise, consider and reflect on uncertainties they are likely to face, and thus to ‘pre-experience’ the unknown. In this process, identifying the range of uncertainties, and appropriate organisational responses to them, is keenly informed by knowledge of past trends. With this in mind, this section summarises the six features of the Australian judicature described above and identifies a number of areas that require future research.
(1) Size and growth. The population of Australian judicial officers has grown substantially over the past 36 years, from 587 officers in 1976, by Chief Justice Barwick’s reckoning, to 1,081 officers in mid-2012, according to Productivity Commission data. In recent years, this growth has not quite kept pace with the growth in the Australian population, but the data record is too thin to signal a long term trend. Indeed, there is a strong correlation between the number of judicial officers and the size of the Australian population. If the number of judicial officers continues to grow at the same linear rate as it did from 1975 to 2012, there will be 1,715 officers by 2056—59 per cent more than in 2012.
(2) Rise of lower courts. Magistrates courts are numerically the most important tier of the Australian court system, accounting for 53 per cent of judicial officers and 93 per cent of all lodgements in 2012. This dominance has increased over time, signalling a significant vertical shift from higher courts to lower courts. Since 2003, the number of magistrates has grown by 18.6 per cent, while the number of supreme court and district court judges has grown by only one or two per cent. This great push downwards has been motivated in part by economic considerations and has gone hand in hand with the rising professionalism and status of the magistracy.
(3) Rise of federal courts. One of the most remarkable transformations in the Australian judicial system in recent decades has been the expansion of federal courts, due in part to a horizontal shift of jurisdiction from state courts to federal courts, and in part to new fields of federal regulation of social and economic activity, which have been entrusted to the new federal courts. In 2012, federal courts represented 14 per cent of the Australian judiciary and 8 per cent of all lodgements. The rapid expansion of the federal judicial system in the 1970s and 1980s has stabilised in recent years, but there have been changing relativities between the federal courts, with the magistrates’ level growing at the expense of the superior federal courts. In the short to medium term, federal courts are likely to remain a small but vital part of the judicial system.
(4) Stratification by subject matter. Civil and criminal matters are of approximately equal importance to the judicial system, whether measured by the allocation of judicial labour or the number of annual lodgements. However, criminal matters have assumed a greater relative importance over time: since 2003, about 65 per cent of new judicial labour has been allocated to crime, while the reduction in the total number of cases lodged in Australian courts has fallen disproportionately on civil matters — seven out of ten ‘lost’ cases are civil. There is also marked stratification between the courts by subject matter: magistrates courts and district courts are predominately criminal courts, while supreme courts are predominantly civil courts. This difference has been a persistent structural feature over the past decade and seems likely to continue.
(5) Regional dynamics. The spatial distribution of Australia’s population has changed significantly over time, with a relative shift away from the south-eastern states in favour of Queensland and Western Australia. Over time, one would expect these patterns to be reflected in the judiciary, and this is partly so—between 2003 and 2012 there were relative declines in the share of the judiciary attributable to New South Wales, South Australia and the Australian Capital Territory. The picture is complicated, however, by the fact that there are large differences in the level at which populations are ‘serviced’ by judicial officers in different states and territories. The limited historical data make it difficult to give confident predictions about likely temporal patterns in the future.
(6) Women in the judiciary. Finally, there has been a transformation within the Australian judiciary, evidenced by changes in the gender composition of the Bench. Female representation has improved significantly over the past decade and today about one-third of judicial officers are women. While this trend is encouraging, there is still significant gender stratification by court level (male dominance increases with court status); there are large differences in gender representation among the state and territory judiciaries; and even the most favourable jurisdictions have some distance to go in achieving gender parity. In the near future, improvements in the gender composition of the stock of judicial officers seem likely to continue. Nevertheless, more attention needs to be paid to gender in the flow of appointments to, and departures from, the Bench if the predominance of women among law graduates is to be reflected over time in the composition of the judiciary.
The features just described have been selected for analysis in this article because they emerge from an examination of the available data. However, other features of the system deserve closer scrutiny if we are to gain a fuller understanding of the dynamic characteristics of the judicial system and if future policies affecting the system are to be empirically well-grounded. The first is the role of alternative dispute resolution in shifting disputes beyond the formal court system. In his 1993 ‘State of the Australian Judicature’ address, Chief Justice Mason remarked that mediation, conciliation and arbitration have reduced the demands made upon the court system, but that a change in legal and commercial culture is needed if the massive cost of adversarial litigation is to be avoided in commercial matters. Yet Chief Justice French has cautioned that, whatever the merits of the ‘Multi-Door’ courthouse, courts are not simply public providers of dispute resolution services, and ADR can never replace the role of the courts in the enforcement of rights and obligations according to law.
A second feature is the existence of a network of tribunals that have a parallel (and sometimes overlapping) role to courts in the resolution of civil disputes. Tribunals are important because, as Chief Justice Gibbs has observed, ‘in a true sense they form part of the judicial system of the nation, and they perform functions which are of great and increasing importance to large sections of society’. Key questions here are whether tribunals have siphoned work from the courts and what impact this has had on their mutual co-existence. The answers require a distinction to be drawn between federal and state tribunals. In the federal sphere, constitutional principles require a strict separation of powers, which ensures that federal tribunals cannot exercise judicial power and hence cannot determine matters that are the proper preserve of the courts. By contrast, there is no formal separation of powers at the state level and legislatures are generally free to confer judicial power on state tribunals. In practice, many state tribunals are empowered to perform judicial work that would otherwise have been undertaken by state courts. The Chief Justice of Victoria has gone so far as to describe state tribunals as ‘tigers in the jungle’, which are increasingly competing with the courts for jurisdiction, power and resources.
A third feature is the fragmentation of the judiciary through the establishment of specialised courts in areas such as environmental, industrial and workers compensation law. Some Chief Justices have perceived a danger that ‘if law comes to be administered through a multitude of special courts the strength and independence of the judiciary may eventually come to be undermined’.
Finally, there is the quest on the part of the Executive for greater flexibility in the supply of judicial labour through increasing use of masters and judicial registrars, the appointment of part time judicial officers, and the commissioning of acting judicial officers on short-term appointments to address temporary backlogs.
In 1977, Chief Justice Barwick thought it ‘appropriate that the Chief Justice of Australia should undertake the task from time to time of indicating the state of the judicature, generalising in an Australian context and ... speaking both of improvement and of the need for correction and development’. For the most part, his successors fulfilled that expectation by addressing broad thematic issues affecting the Australian judiciary. Hampered by lack of data, they generally failed to describe or account for the characteristics of a dynamic system experiencing both growth and decay. Today, comprehensive information on key aspects of the judicial system remains a scarce commodity, but sufficient data are available to make the exercise worthwhile. An initial task, to which this article is a small contribution, is to use the available data to describe and explain the judicial system as it currently operates. In the medium term, there is a pressing need for more empirical research to bring us to a fuller understanding of the Australian judicature and its likely trajectory over the coming decades. In the longer term, comparative research on these matters is also desirable, as an aid to understanding the drivers of change in judicial systems that may have shared traditions or face similar challenges.
APPENDIX: State of the Australian Judicature Addresses
|
Year
|
Chief Justice
|
Australian Legal Convention
|
Location
|
Date
|
Publication
|
|
1977
|
Barwick
|
19th
|
Sydney
|
8 July
|
|
|
1979
|
Barwick
|
20th
|
Adelaide
|
2 July
|
|
|
1981
|
Gibbs
|
21st
|
Hobart
|
10 July
|
|
|
1983
|
Gibbs
|
22nd
|
Brisbane
|
8 July
|
(1983) 4(12) Legal Reporter 4
|
|
1985
|
Gibbs
|
23rd
|
Melbourne
|
5 Aug
|
|
|
1987
|
Mason
|
24th
|
Perth
|
20 Sep
|
|
|
1989
|
Mason
|
26th
|
Sydney
|
18 Aug
|
|
|
1993
|
Mason
|
28th
|
Hobart
|
30 Sep
|
|
|
1997
|
Brennan
|
30th
|
Melbourne
|
19 Sep
|
|
|
1999
|
Gleeson
|
31st
|
Canberra
|
10 Oct
|
|
|
2001
|
Gleeson
|
32nd
|
Canberra
|
14 Oct
|
|
|
2003
|
Gleeson
|
33rd
|
Melbourne
|
17 April
|
|
|
2005
|
Gleeson
|
34th
|
Gold Coast
|
24 March
|
|
|
2007
|
Gleeson
|
35th
|
Sydney
|
25 March
|
|
|
2009
|
French
|
36th
|
Perth
|
18 Sep
|
AustLII:
Copyright Policy
|
Disclaimers
|
Privacy Policy
|
Feedback
URL: http://www.austlii.edu.au/au/journals/UTSLRS/2013/1.html