
|
|
Home
| Databases
| WorldLII
| Search
| Feedback
University of Technology Sydney Law Research Series |
Last Updated: 15 February 2017
Population, Crime and Courts:
Demographic Projections of the Future Workload of the
New South Wales Magistracy
Brian Opeskin
Macquarie University (brian.opeskin@mq.edu.au) &
Nick Parr
Macquarie University (nick.parr@mq.edu.au)
To be published in
(2014) 23(4) Journal of Judicial Administration (forthcoming)
ABSTRACT
The New South Wales Local Court is the largest court in Australia. This study seeks to facilitate future planning for the Court by making demographic projections of the criminal workload of the Court over the next 25 years (criminal matters account for 95 per cent of its new lodgements). The study applies criminal conviction rates by age, sex and locality to population projections for the state to produce projections of the number of criminal convictions for the state and its geospatial subdivisions. These statistics are used to derive the demand for magistrates and a comparison is then made of the supply of magistrates under different scenarios. The principal finding is that, due to demographic change alone, the number of criminal convictions is projected to increase by 16 per cent by 2036, with nearly all the increase occurring in Sydney, especially in the city’s west and south west. This is less than the projected 26 per cent increase in the population of the state because the positive impact of population growth on criminal convictions is partly offset by the reduction in the proportion of young adults in the population, where criminal conviction rates are highest. On the assumption of constant criminal conviction rates and constant judicial productivity, the demand for magistrates is also projected to rise by 16 per cent, to 158 magistrates by 2036. If recruitment of magistrates were to take place only in accordance with historic trends, there would be a shortfall of 10.5 magistrates over the projection period. Thus, if the Local Court is to have sufficient judicial resources to meet the projected demand for its services, government will need to be attentive to the potential for a growing gap between demand and supply in the years ahead.
KEYWORDS
Applied demography, Australia, caseload, courts, crime rates, criminal convictions, demand and supply, Local Court, magistrates, New South Wales, population projections, productivity, workload
ACKNOWLEDGEMENTS
This research had its origins in a study commissioned by the New South Wales Department of Attorney General and Justice, with the support of the Chief Magistrate of New South Wales. We wish to thank officers in that Department—especially Shanyn Cardinale, Craig Jones, Michael Talbot, Brendan Thomas and Don Weatherburn—for their assistance and comments, and express our gratitude to the Chief Magistrate, Judge Graeme Henson, for his advice and encouragement. We also extend our thanks to our research assistants—Simon Massey, Amy Lo, Bronwyn Lo, and Chris Prestipino—for research and analysis on a variety of demographic and legal aspects of this project.
1. Introduction
The New South Wales Local Court is the largest court in Australia. Whether assessed in terms of the number of judicial officers (there were 144 fulltime equivalent magistrates in 2012, 13 per cent of the Australian judiciary) or the volume of cases (342,378 matters were lodged in the Court in 2012, 23 per cent of all Australian lodgements), the Local Court is a significant institution in the Australian legal landscape.[1] It is also an institution potentially under strain. Although the total number of cases lodged in the Court has fallen substantially since it peaked in 1999, cases are said to have become more complex and this may have had an adverse impact on the workload of the magistracy. In a survey of judicial officers in 2007, 67 per cent of Australian magistrates considered that their judicial functions had increased since their appointment.[2] Qualitatively, it has also been said that the Local Court is subject to a growing range of sometimes incompatible demands when discharging its large daily caseload, including pressure to be more punitive, effective, efficient and responsive to the special needs of particular groups.[3]
What is likely to become of Australia’s largest court over the coming decades? This study focusses on the implications of prospective demographic change for the workload of the Court over the next 25 years. The study provides a foundation for workforce planning, which is a process that seeks to predict future labour market needs: ‘It requires an understanding of the make-up of the current workforce, an investigation into future service needs and an analysis of the type and size of workforce required to meet them.’[4] The study can also inform other aspects of service planning, such as budgetary allocation and long term strategies for the construction and relocation of court facilities.[5]
The need for workforce planning arises for many reasons, but demographic change is an important consideration because changes in population size, composition and spatial distribution are significant long term determinants of labour demand and supply in many service sectors. Demographic considerations are especially relevant to the demand for adjudication in criminal matters—for example, there is a link between crime rates and the age-sex composition of a population.[6] This study accordingly seeks to identify the demand and supply of magistrates in New South Wales based on historic trends and plausible assumptions about the future population.
This study does not attempt to model all the determinants of a court’s workload, which are undeniably complex. Rather, this is a demographic study that seeks to isolate and analyse the impact of population change as a basis for informing government policy with respect to the courts. A better appreciation of the impact of population dynamics is valuable in its own right, but still leaves scope for further research that seeks a fuller account of the factors that underpin judicial workload. Matters that might be relevant to any extended study include legislative changes that expand or contract the criminal law (eg decriminalising recreational drug use); changes in the jurisdictional relationship between the Local Court and other courts in the hierarchy (eg allowing a larger number of offences to be dealt with summarily by magistrates); and the level and location of policing of crime.
The role of crime is critical in projecting future workforce needs of the Local Court. The Local Court has a broad jurisdiction comprised of criminal matters, civil matters, children’s matters and family law matters, as well as a number of specialist jurisdictions.[7] However, criminal matters predominate. The Local Court’s criminal jurisdiction encompasses the vast majority of summary prosecutions in the State, and includes the summary hearing of some indictable offences and committal proceedings to determine whether an indictable offence will be committed to trial in the District Court or the Supreme Court. According to workload statistics compiled by the Local Court, of all new matters commenced in the Court in 2010, criminal matters accounted for 86.8 per cent of matters from the above four sources. When account is taken of the high proportion of criminal matters within the Court’s children’s jurisdiction, it can be said that about 95 per cent of all new matters commenced in the Local Court in 2010 were crime-related.
The work of a magistrates’ court has important spatial dimensions that are largely absent from higher courts. Since the 12th century, English courts have travelled to the people, bringing the King’s justice with them.[8] In criminal matters this continues to be a fundamental principle, as well as a practical necessity. It is therefore not surprising that the Local Court—as its name suggests—operates extensively across the state in urban, rural and remote communities. As at 31 December 2011, the Court presided at 150 locations,[9] more than any other court in Australia.
Workforce planning for the New South Wales magistracy over the next 25 years rests on four pillars, namely: (a) demographic projections of the population of New South Wales to 2036; (b) projections of the level of criminal convictions in the Local Court to 2036; (c) projections of the derived demand for magistrates, based on certain productivity assumptions; and (d) projections of the supply of magistrates based on different attrition and recruitment scenarios. These pillars are addressed in successive sections below, but first it is necessary to outline the conceptual foundations of the study, the data sources, and the principal findings.
Conceptual Model
This study is based on a conceptual model of the demand and supply of magistrates illustrated in Figure 1. On the demand side, the model links changes in the population (the independent variable) to changes in the demand for magistrates (the dependent variable) through a number of intermediate steps. Population growth typically affects the volume of human activity (such as crime) that occurs within a community. It stands to reason that a city of 1,000,000 people will experience a greater volume of crime than a city of 100,000 simply because it has ten times the number of potential offenders and victims.[10] However, the volume of crime is affected not only by the absolute size of a population but also by its age-sex composition and its spatial distribution because crime rates vary by age, sex and locality. The model posits that the volume of crime affects the workload of the courts, which in turn affects the demand for judicial officers who discharge that workload. On the supply side, the current workforce of magistrates is diminished by attrition due to retirement, resignation, death and removal; and enhanced through recruitment of judicial officers (which, in Australia, lies in the hands of the executive).[11] The model also considers prospective changes in the magistrate workforce, particularly ageing, and their implications for attrition and recruitment.
[Insert Figure 1 about here]
Data Sources
The first pillar of the study examines demographic data on the projected future size, age-sex composition and spatial distribution of the New South Wales population from 2011 to 2036, by region. These data were sourced from the New South Wales Department of Planning, which itself relies on Australian Bureau of Statistics census data, but incorporates growth assumptions that are relevant to small area population movements specific to the State and based on analysis of past trends.[12]
The second pillar makes projections of the level of criminal convictions in the Local Court from 2011 to 2036. Data were sourced from the New South Wales Bureau of Crime Statistics and Research (BOCSAR) using customised statistics on the number of persons convicted in the Local Courts, categorised by principal offence, place of residence, sex, age, and year of conviction.[13] These data are classified using the same geospatial units as the population data (at that time, the Australian Standard Geographical Classification), thus providing a basis for comparison.[14] Criminal conviction rates by age and sex were applied to the population projections to produce projections of the number of criminal convictions for New South Wales and its geospatial sub-divisions. BOCSAR also collects data on reported crime but this was considered to be a less accurate predictor of court workload. Criminal convictions are a better proxy because they have a closer nexus to judicial workload than measures of crime volume that calibrate crime at points in time before the processes of the Local Court are engaged.
The third pillar makes projections about the future demand for magistrates based on the projected number of criminal convictions over the next 25 years. For this purpose, it is necessary to make an assumption about judicial productivity (i.e. the number criminal convictions per magistrate per year). No additional statistics were needed for this calculation, which is derived from information used in other pillars.
The fourth pillar makes projections about the supply of magistrates in New South Wales from 2011 to 2036. Statistics on New South Wales magistrates were obtained from the Department of Attorney General and Justice, extracted from databases maintained for internal administrative purposes. The magistrates’ data captured all persons who have held office as a magistrate in New South Wales from 1 January 1985 until 31 December 2011. The former date is significant because it is the date on which the Local Courts Act 1982 (NSW) commenced operation, and is thus the date on which magistrates first became independent judicial officers, in contrast to their former status as stipendiary magistrates appointed to the public service.[15]
Principal findings
The key findings of the study are as follows. First, over the next 25 years the resident population of New South Wales is projected to increase by 26 per cent, to 9.07 million. Geographically, increases are projected to be most rapid in outer Sydney, particularly in the North-West and South-West. The population will also age significantly (the median age will increase by 3.3 years), and the proportion of the population aged 20–34 years will fall.
Secondly, the number of criminal convictions in the Local Court is projected to increase by 16 per cent over the same period. This is less than the projected 26 per cent increase in the resident population because the positive impact of population growth on criminal convictions is somewhat offset by the gradual ageing of the population. Geographically, almost all the increase in the annual number of criminal convictions is projected to occur in Sydney, and within Sydney the greatest increases are projected to occur in the west and south west of the city.
Thirdly, based on an assumption of constant judicial productivity, the demand for magistrates is also projected to increase by 16 per cent over the next 25 years, in line with the projected increase in criminal convictions. This would increase the demand from 136 magistrates in 2011 to 158.2 magistrates in 2036. Geographically, the projected demand for additional magistrates is driven overwhelmingly by an increase in criminal convictions in the Sydney region.
Finally, the determinants of the supply of magistrates are complex and include factors that affect the rate of departure from, and appointment to, the bench. The projections made in this study permit analysis of potential gaps between the demand and supply of magistrates over the next 25 years. The most important potential gap is that the overall level of recruitment may be inadequate to meet the demand for magistrates that arises from the projected rise in the level of criminal convictions for the state as whole. On the assumptions made, 158.2 magistrates would be required to meet that demand by 2036, creating a shortfall of 10.5 magistrates if recruitment were to take place only in accordance with historic trends, and creating a shortfall of 22.2 magistrates if recruitment were limited to maintenance of the current staffing level. In addition to supply gaps that may arise from the overall level of recruitment, temporal gaps may arise due to the timing of departures and arrivals within the course of a year, and spatial gaps may arise in particular localities if judicial resources are not deployed where they are most needed.
If the Local Court is to have sufficient judicial resources to meet the projected demand for its services, the Executive will need to be attentive to the potential for a growing gap between demand and supply in the years to come.
1. Population
Future population trends for New South Wales as a whole and for its geographical subregions will have important implications for the need for judicial services and personnel, both in total and in terms of their spatial location. This section reviews past population trends for the State and its subregions over the period 1985 to 2010 and discusses projections of the future population of the state.
Population projections are calculations of what the future population would be if specified assumptions relating to its future growth were to be realised.[16] They are a sophisticated instrument for assessing the size and composition of a future population and have become a standard demographic tool since the cohort-component projection method was refined in the 1940s.[17] The most recently published set of projections project the population for New South Wales as a whole, for 13 regions of the State, and for Statistical Local Areas from 2006 to 2036.[18] The core assumptions are that the total fertility rate is constant at 1.85 births per woman; that life expectancy of males and females will continue to increase; and that there will be net international migration to New South Wales of 50,000 persons per year and a net loss to other states and territories of 20,000 persons per year. These assumptions appear reasonable in light of past trends.
Growth
Between 1985 and 2010 the estimated resident population of New South Wales increased by 32 per cent, from 5.50 million to 7.23 million. This increase was less than the 40 per cent growth in the total Australian population over the same period. Changes in any population are due to only three demographic events—births, deaths and migration. The growth in the New South Wales population was due to net natural increase (births minus deaths) and net international migration. However, there was a net loss of people to other Australian states and territories, which partially offset the other components of population change. Queensland has been consistently the major destination for those departing from New South Wales.
Over the next 25 years, the population of New South Wales is projected to grow significantly and steadily by 26 per cent to 9.07 million by 2036 (Figure 2). A large majority of this growth is projected to take place in Sydney rather than in the balance of the state, with the capital’s contribution to population growth increasing over time.[19]
[Insert Figure 2 about here]
Age and sex composition
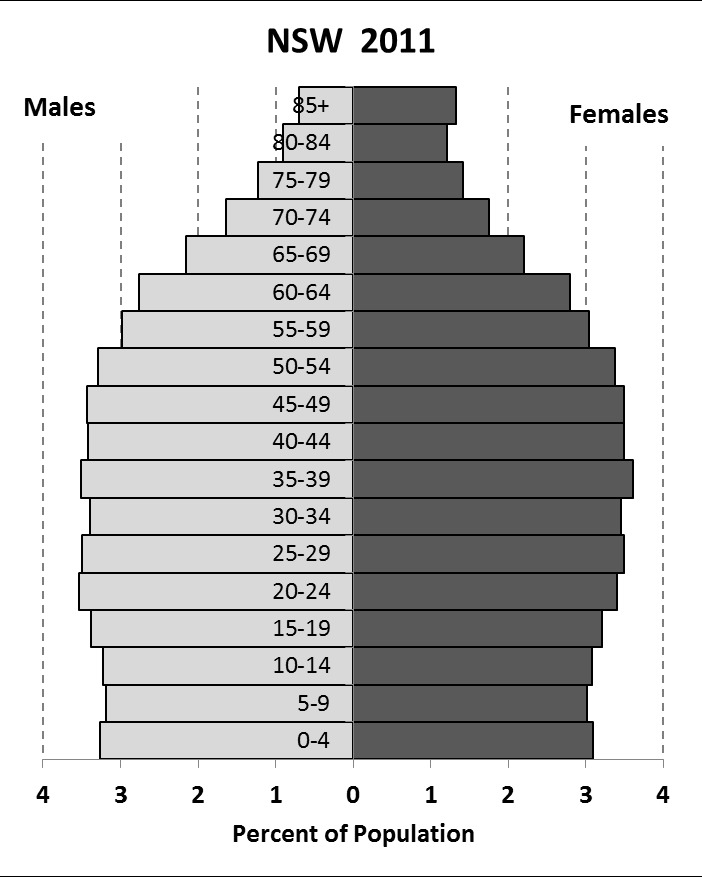
The age distribution of the state’s population in 2010 has the ‘beehive’ shape that is typically associated with populations that have a long-established pattern of low fertility rates, low mortality rates, and significant net immigration (Figure 3). The proportion of the population comprised by young adults, which is of special relevance to crime rates, can be seen in the corresponding bars of the graph. In 2011, persons aged 15–29 years comprised 20.5 per cent of the population of the state. Overall, the age distribution of state’s population was slightly older than that for Australia as a whole, but within the state the age distribution varies significantly by region. The highest proportion of the population aged 20–34 years is found in Inner Sydney and the lowest proportion in the Northern, Mid and South Coasts.
Over the next 25 years the state’s population is projected to increase in absolute terms for all age and sex groups, but in percentage terms the increases are projected to be greatest in the older age groups. Consequently, the state’s population will age significantly, with the median age increasing from 37.5 years to 40.8 years by 2036.[20] This is reflected in the growth of the cohorts of particular relevance to this study: in comparison with the projected growth of 26 per cent in the total population, more modest growth is projected for those aged 15–19 years (13.5 per cent), 20–24 years (13.5 per cent) and 25–29 years (15.1 per cent). In 2036, persons aged 15–29 years are projected to comprise only 18.6 per cent of the state’s population, a decline of nearly two percentage points, or 9.6 per cent, over 25 years.
[Insert Figure 3 about here]
Spatial distribution
The spatial distribution of Australia’s population has changed significantly over time, making it ‘one of the most dynamic and policy-relevant dimensions of the nation’s contemporary demography’.[21] The long term implications of these regional population trends are likely to be significant for state courts, especially magistrates’ courts, which operate at a local level.
The population of New South Wales is heavily concentrated in a few major cities, with the Sydney Statistical Division alone accounting for 63 per cent, followed by the Hunter (9.0 per cent) and Illawarra (6.0 per cent). Between 1985 and 2010 the percentage growth of Sydney’s population (32 per cent) was higher than that of the balance of the state (27 per cent). Sydney’s population also has a higher percentage of its total in the 20–44 years age range compared to the balance of the state. This reflects the fact that Sydney has tended to receive net gains of young adults due to internal and international migration and net losses of both children and middle-aged and older adults due to internal migration.[22]
Over the next 25 years, the population of Sydney is projected to increase by just under a third of its current size, from 4.55 million in 2011 to 5.98 million in 2036. The balance of the state is also projected to increase, but at a slower percentage rate than Sydney, from 2.64 million in 2011 to 3.01 million on 2036.[23] Within Sydney, all the statistical subregions are projected to experience population increase but in percentage terms the increases are projected to be most rapid in outer Sydney, particularly in the North-West and South-West. The pattern of growth of the young adult populations is projected to differ markedly between Sydney and the balance of the state. In Sydney, young adults aged 15–29 years are projected to increase in number by 22.6 per cent between 2011 and 2036 (which is still less than the 26 per cent increase projected for the whole population), whereas in the balance of the state these age groups are projected to decrease by 4.1 per cent.
2. Criminal Convictions
As noted above, the Local Court has a diverse jurisdiction but criminal matters overwhelmingly dominate its workload. For this reason, civil matters, family matters and non-criminal children’s matters are unlikely to drive future workload patterns when making long-term projections. This study examines past trends and future projections in the criminal work of the Court using ‘criminal convictions’ as the measure of workload. The analysis proceeds by determining the historical rates of criminal conviction by age, sex and locality, and then determining the projected number of criminal convictions by applying the historical rates to the projected population by age, sex and locality.
The offence categories investigated were selected from the highest (divisional) category of the Australian and New Zealand Standard Offence Classification.[24] Attention was focussed on the five largest offence categories, which in 2010 accounted for 75 per cent of all persons convicted in the Local Court (Table 1).
[Insert Table 1 about here]
Rates of criminal conviction by age, sex and type of offence
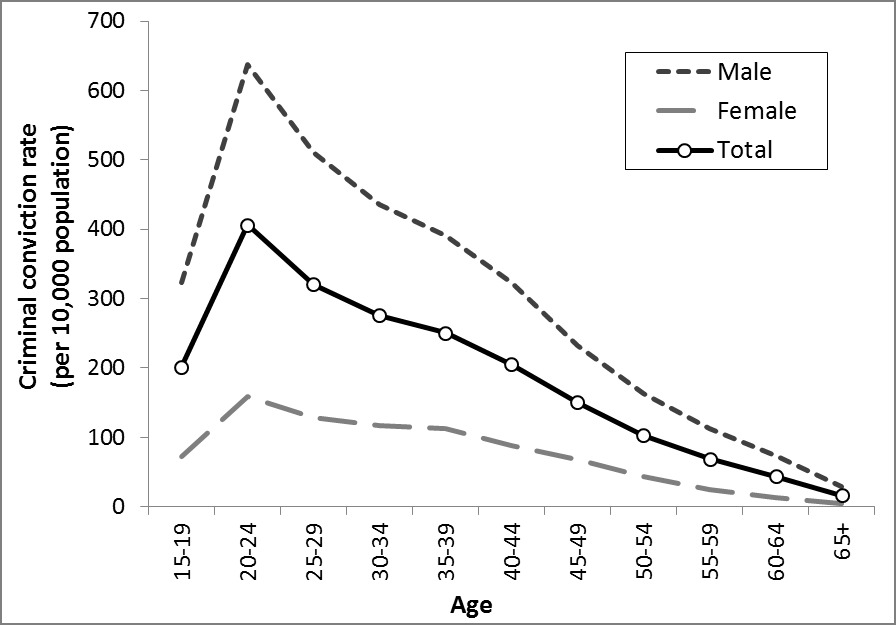
In the year ended 30 June 2010, 106,221 individuals were convicted in the Local Court, which equates to an overall rate of 146.9 convictions per 10,000 population. However, the rate of criminal conviction varies substantially by age and sex of the offender. The criminal conviction rate for males (231.6) is four times higher than that for females (58.2), and this trend is evident in every age group (Figure 4). Both for males and for females, the criminal conviction rate is highest for the 20–24 age range (637.6 for males; 159.1 for females). The decrease in criminal conviction rates with advancing age is more rapid for males than for females.
[Insert Figure 4 about here]
Criminal conviction rates also vary by type of principal offence, being highest for traffic and vehicle regulatory offences and lowest (among the top five) for public order offences. For each type of offence, the criminal conviction rate peaks in the 20–24 age range (Figure 5). An analysis by age, sex and type of offence reveals that for each type of offence the criminal conviction rate for males is higher than that for females. For theft and related offences the criminal conviction rate for males is just over double that for females, while for all other offence categories the rate for males is four or five times that for females.
The implication of these patterns is that some of the variability in criminal conviction rates per head of population (‘crude’ rates) between locations, and some of the changes over time, are attributable to differences in the age and sex composition of these populations, most notably differences in the proportions of young adults. The effects of the differences in population age and sex composition can be removed using a demographic method known as standardisation.[25]
[Insert Figure 5 about here]
Rates of criminal conviction by location
When considered on a crude per capita basis, the overall criminal conviction rate was lower for Sydney (123.2) than for the balance of the state (159.0) (Table 2). However, these regions have different population structures. Sydney has a higher percentage of its population in the young adult ages, which are also the ages for which criminal conviction rates are the highest. It is thus necessary to standardise the rates to adjust for structural differences in the populations, in this case using the total population of New South Wales as the standard. With this correction, the difference in criminal conviction rates between Sydney and the balance of the state is even greater than when considered on a crude per capita basis—116.2 in Sydney compared with 176.6 in the balance of the state—representing a 52 per cent excess in the rate of criminal convictions outside the state’s capital.
[Insert Table 2 about here]
In 2010 the highest age-standardised criminal conviction rates were for regions in the interior of the state, specifically the Far West (290.4), North-Western (272.2) and Northern (212.1) regions. The two areas outside Sydney with the lowest criminal conviction rates were the two most urbanised, namely Illawarra (148.3) and the Hunter (156.5). Within Sydney there is a clear social divide in criminal conviction rates. The areas with the lowest rates are all relatively prosperous areas in Sydney’s north or east, with Lower Northern Sydney (54.9) and Central Northern Sydney (66.8) having the lowest rates of all. On a crude per capita basis, Inner Sydney has the highest criminal conviction rate (178.0). However, after standardising for age, it is the regions on the semi-rural periphery of Sydney that have the highest criminal conviction rates, namely, Outer South-Western Sydney (168.6), Gosford-Wyong (160.5) and Blacktown (158.3).
Projected number of criminal convictions
Projections of future numbers of criminal convictions by locality were prepared for the period 2011–2036 by applying the 2010 criminal conviction rates by age and sex to the projected future population by age and sex in each locality. As such, the results reflect the assumptions on which the population projections rest. The projected effects of population change on the number of criminal convictions will be greater in localities with historically higher standardised criminal conviction rates, and greater in localities where growth in the young adult population accounts for a higher percentage of the projected population growth.
The assumption of constant (2010) age and sex specific criminal conviction rates was adopted in accordance with the most recently available data on criminal conviction rates in New South Wales. In view of changes to the manner of recording criminal conviction data, extrapolation of time series trends for past data would not have been statistically valid. The relative stability of criminal conviction rates for those past years for which comparable data are available indicates the assumption is reasonable, but alternative assumptions are considered in the sensitivity analysis in section 3 below.
The projections indicate that the annual number of criminal convictions in the Local Court will increase steadily from 100,851 in 2011 to 117,326 in 2036—a 16 per cent increase. The main driver is the projected growth of the population, tempered by a slight reduction in the crude criminal conviction rate per 10,000 population, from 146.9 in 2010 to 129.4 in 2036. This reduction is due to the ageing of the state’s population—over time, a higher proportion of the population will be found in older age groups characterised by lower age-specific criminal conviction rates. This is consistent with other studies that have shown that structural ageing of the Australian population has had a favourable impact on crime levels.[26]
Geographically, almost all the increase in the annual number of criminal convictions from 2011 to 2036 is projected to occur in Sydney. In comparison with the projected 16 per cent growth in criminal convictions for the state as a whole, Sydney is projected to experience an increase of 23 per cent. Within Sydney, increases are projected to occur in all statistical subdivisions, with the largest increases occurring in Outer South Western Sydney (51 per cent), Blacktown (37 per cent), and Fairfield-Liverpool (31 per cent)—significantly above the Sydney average.
The number of criminal convictions for the balance of the state is projected to remain virtually unchanged. Although the population in the balance of the state is projected to grow in total, the impact of this growth is cancelled out by a projected decrease in the size of the 15–24 age group and, of lesser importance, in the 40–54 age group. The overall constancy in the projected number of criminal convictions in the balance of the state also masks an east-west divide, with modest projected growth in the growing coastal regions and projected declines in inland regions.
3. Demand for Magistrates
The demand for magistrates is a derived demand—it arises from the need for the services of magistrates in dispensing justice by hearing and determining cases, principally in its criminal jurisdiction. There are three components to ascertaining this demand: the initial population of magistrates as a baseline from which projections are made; the number of cases a magistrate can determine each year (a productivity measure); and the projected number and spatial distribution of cases per year, measured here by the number of criminal convictions.
Initial population of magistrates
Data provided by the New South Wales Department of Attorney-General and Justice show that on 30 June 2011 there were 136 magistrates in the state—a net increase of 19 magistrates (16 per cent) since 1985. The departmental figures are a ‘body count’—they include every person who holds a commission as a magistrate on 30 June each year regardless of the level of service rendered by that person. As a measure of judicial labour, this count is over-inclusive in so far as it includes magistrates who work part-time, are on extended leave, or are seconded to other bodies; and it is under-inclusive in so far as it excludes acting magistrates (often recent retirees) who are appointed for successive 12 month terms pursuant to s 16 of the Local Court Act 2007 (NSW).
By contrast, the Productivity Commission’s annual Report on Government Services publishes data on the number of full-time equivalent (FTE) magistrates,[27] which corrects these deficiencies and thus provides a more accurate measure of the capacity of the magistracy to hear and determine cases. In practice, the difference between the two types of data has been modest—for example, in 2011 the departmental data represented a 6.3 per cent undercount. While the choice of initial population will affect projections of the absolute number of magistrates, it does not affect percentage changes over time. Moreover, the departmental data are available for a longer period (27 years compared with 10 years for the Productivity Commission), allowing a more accurate assessment of long term trends. Accordingly, we take the departmental data as the baseline from which projections of demand are made.
Judicial productivity
The Productivity Commission has described ‘productivity’ as a supply-side measure that captures technical production relationships between inputs and outputs: ‘[i]t is calculated as the ratio of the quantity of outputs produced to some measure of the quantity of inputs used’.[28] In this study, productivity is taken to be the quantity of finalised matters per year of magistrate labour. The concept is easy to state but can be difficult to apply to the determination of legal disputes. A former Chief Justice of New South Wales has remarked that ‘the most important aspects of the work of the courts are qualitative and cannot be measured’.[29] These qualities include the values of accessibility, openness, fairness, impartiality, legitimacy, participation, honesty and rationality.
In addition to this conceptual concern, there is the practical difficulty that cases determined by magistrates differ in length and complexity in a way that is not captured by a statistic that merely counts whether a matter has been ‘finalised’ by conviction of an offender. However, this does not invalidate the analysis. The annual criminal caseload of the Local Court is very large, so that differences between cases are likely to balance out over the course of a year.
The productivity of magistrates was calculated by comparing the number of criminal convictions in the Local Court in the year ended 30 June with the average number of magistrates holding office during that year. For example, in the year ended 30 June 2011, there were 100,851 projected criminal convictions in the Local Court across all offence types, determined by an average of 136.0 magistrates, giving a productivity measure of 741.6 convictions per magistrate per year. Due to changes in the way criminal convictions were recorded in 2010, it is more reliable to use this recent measure as an indicator of future productivity rather than, say, an average over several previous years. We assume constant judicial productivity of 741.6 convictions per magistrate per year, but alternative assumptions are considered in the sensitivity analysis below.
The Australian Productivity Commission also collects and disseminates data on the efficiency of government-funded social services, including the courts. Its annual Report on Government Services measures court productivity (inputs per unit of output) using four performance indicators—judicial officers per finalisation; full-time equivalent staff per finalisation; cost per finalisation; and clearance rates.[30] The first of these indicators is merely the inverse of the measure described in the previous paragraph, but it uses the broader concept of ‘finalisations’ in lieu of ‘criminal convictions’ as the unit of output. The four performance indicators focus on different aspects of judicial productivity and they are best seen as a package. Nevertheless, some jurisdictions—particularly in the United States—are much further advanced in utilising ‘weighted caseload’ as a measure of individual and institutional judicial performance.[31] Unfortunately such data are not available for the Local Court.
Level of demand and its spatial dimensions
Table 3 shows the projected demand for magistrates from 2011 to 2036 for the state as a whole and by region, based on the assumptions described above. The first row lists the projected number of criminal convictions at five-year intervals. This figure, when divided by the assumed output per magistrate, yields a notional demand for magistrates. This was converted into an index in which 2011 is set as the base year (index=100). The second row of the table shows that the projected demand for magistrates increases by 16.3 per cent over the period 2011–2036 (index=116.3). By necessity, this is the same as the projected percentage increase in the level of criminal convictions because of the assumption of constant judicial productivity. The index has been applied to the current level of court staffing to gain a better understanding of what this means for the actual count of magistrates in the future. At 30 June 2011, 136 magistrates held commissions on the Local Court, and on this basis the demand for magistrates is projected to rise to 144.4 persons by 2021 and to 158.2 persons by 2036.
The lower portion of Table 3 shows how the demand for magistrates is spread across the state, based on the each region’s share of the state’s projected number of criminal convictions. The demand for additional magistrates is driven entirely by increased convictions in the Sydney region, where there is projected to be a 28.5 per cent increase in the demand for magistrates, from 78.3 magistrates in 2011 to 100.6 magistrates in 2036. The three areas with the greatest percentage increase in demand are Outer-South Western, Blacktown, and Fairfield-Liverpool. By contrast, the demand for magistrates in the balance of the state is virtually unchanged, with large proportionate declines in inland regions being offset by increases in the growing coastal regions.
[Insert Table 3 about here]
Sensitivity analysis
The projections of demand outlined above assume that judicial productivity and criminal conviction rates are constant at 2011 values. It is natural to ask how different assumptions about these parameters affect the projected demand for magistrates. For example, it is plausible that changes in the work patterns of the Local Court may enhance productivity in the future, particularly through the use of information technology.[32] Additionally, it is arguable that the continuing economic decline of rural communities in Australia may lead to increased rural crime rates in the future, especially for violent crime and property offences.[33] At a broad level, the impact of different assumptions can be seen in the sensitivity analysis in Table 4, which shows the demand for magistrates in 2036 (the end of the projection period), in comparison with the base year of 2011, when there were 136 magistrates. Thus, as already discussed, demand in 2036 is 158.2 magistrates (i.e. 22.2 magistrates more than in 2011) if judicial productivity and criminal conviction rates are assumed constant. For any specified criminal conviction rate, the demand for magistrates falls with increasing judicial productivity and rises with falling judicial productivity, as can be seen by moving north or south in any column. For any specified rate of judicial productivity, the demand for magistrates rises with increasing criminal conviction rates and falls with declining criminal conviction rates, as can be seen by moving east or west in any row. The stepped line is an isobar that separates areas of declining demand for magistrates (north-west sector) from areas of increasing demand (south-east sector).
This sensitivity analysis has important implications both for the behaviour of the model and the policy prescriptions that flow from it, and is especially useful in testing the effects of uncertainties in parameter values.[34] For example, starting from the earlier assumption of constant judicial productivity and conviction rates, a 10 per cent increase in productivity tempers the increase in demand from 158.2 magistrates to 143.8 magistrates over the period 2011–2036, while a further 10 per cent increase in productivity reduces demand in 2036 to 131.8 magistrates, which is below the 2011 level (136.0 magistrates). This has obvious implications for the optimal rate of recruitment of new judicial officers.
[Insert Table 4 about here]
4. Supply of Magistrates
The supply of magistrates is the product of a number of forces that affect attrition from the workforce through departures, and accretion to the workforce through appointments. Attrition is affected by the natural forces of mortality, such as when a magistrate dies in office; and ageing, such as when a magistrate reaches the maximum retirement age (currently 72 years) through effluxion of time. Attrition is also affected by decisions of magistrates to resign from office before reaching the statutory maximum—for example, in response to financial incentives of superannuation schemes. In general terms, the schemes available to magistrates have become less generous over time, offering lesser benefits at later ages. Attrition rates are considerably higher for magistrates over the age of 55 than below it. There have been gradual reductions over time in attrition rates within each age group, reflecting a move towards later retirement.
Accretion to the magistrates’ workforce is determined by decisions of the executive government to make appointments to replace departing judicial officers or bolster existing ranks with new appointments. The quantum and timing of these appointments is at the discretion of the executive. Over the period 2006–2011, the ages of newly-appointed magistrates ranged widely between 34.8 to 59.9 years, but were heavily concentrated in the 45–54 age range.
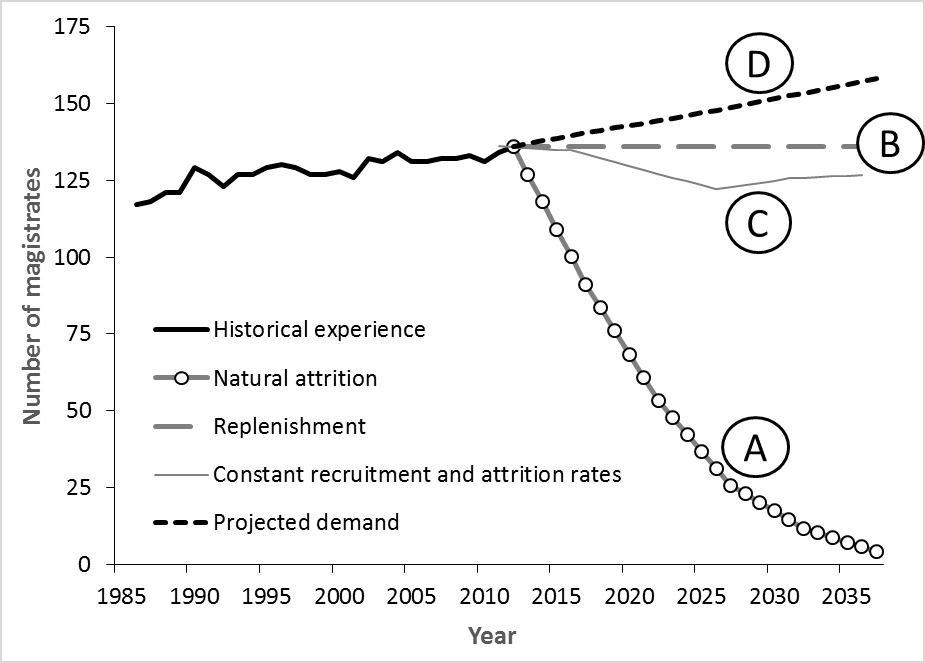
Figure 6 plots the number of magistrates from 1985 to 2011, and then identifies four supply scenarios for the future. It should be read in conjunction with Table 5, which identifies key attributes of the magistrate workforce (start size, attrition, recruitment, end size and median age) in five-yearly intervals from 2011 to 2036.
Scenario A is one of natural attrition in which magistrates who depart the Court are not replaced. This is estimated by applying attrition rates by age for the 2006–2011 period to the population of 136 magistrates who held office on 30 June 2011 to project a distribution of magistrates by age for 2016, and then iteratively applying the same ratios to projections of the magistrate population by age. Line A shows that, on this scenario, there is an abrupt falling away of the magistrates’ population, with only a small number surviving to 2036. The diminution of the magistrates workforce is accelerated by the ageing of the remaining magistrates over time and, hence, their increasing concentration in the ages with high rates of attrition. Under this scenario, the median age of the workforce climbs sharply from 55.3 years in 2011 to 63.2 years in 2031.
[Insert Figure 6 about here]
[Insert Table 5 about here]
Scenario B assumes that the population of magistrates is replenished to its 2011 level of 136 magistrates by regular recruitment, such that the number of departures in any year is matched by an equal number of appointments. By assumption, there will be 136 magistrates in 2036. If the number of criminal convictions continues to rise, there will be inadequate judicial resources to meet the demand. As a consequence, court delays may increase, or steps will have to be taken to increase judicial productivity to absorb the additional caseload. Under this scenario the number of new recruits needed to maintain a workforce of constant size rises from 44.9 for the five year period 2011–2016 to a peak of 50.0 by 2021–2026, and remains relatively high thereafter. The median age of magistrates is projected to increase from 55.3 years in 2011 to 56.2 in 2021 before falling slightly to 56.0 in 2036. The projected future needs for recruitment above the current level are to balance projected changes in attrition, which are due to the ageing of the magistrate workforce.
Scenario C is similar to the preceding one, except that replenishment is fixed at the current level, whilst attrition is projected by applying the current (2006–2011) rates of attrition by age to the age structure of the workforce. (Line C). The magistrate workforce falls from 136.0 in 2011 to 122.1 in 2026 before recovering slightly to 126.7 in 2036. A considerable increase in the median age to 57.4 years in 2016 precedes the steeper reductions in workforce size. The magistrate workforce remains older than in 2011 throughout the projection period.
Scenario D assumes that magistrates will be appointed beyond the historical trend to meet the demand generated by the projected level of criminal convictions. Line D shows the projected population of magistrates year by year, from which select quinquennial data are reported in row three of Table 3. By 2036, 158.2 magistrates would be required across the state, 22.2 more than the status quo in Scenario B. The recruitment needed to sustain this growth trajectory increases from 49.4 appointments between 2011 and 2016 to 59.5 new appointments between 2031 and 2036. Whilst the workforce is projected to be older than in 2011, the higher rates of recruitment under this scenario lead to a slightly younger workforce than under Scenario B.
This analysis provides the tools for assessing the relationship between the demand and supply of magistrates over the projection period. Only Scenario D results in a matching of demand and supply because the number of magistrates increases at the same rate as criminal convictions. However, gaps between demand and supply can arise in three different ways.
First, demand may exceed supply because the overall level of recruitment of magistrates is inadequate to meet the projected rise in the level of criminal convictions for the state as a whole. Scenarios A, B and C are examples of this type of gap, albeit with differing levels of severity. Second, demand may exceed supply at particular points in time due to the timing of departures and arrivals within the course of a year. A temporal gap might arise, for example, if a magistrate departs on 1 January and is replaced by another on 29 June in the same year. At the census date (30 June), no loss of staff would be recorded, but the Court would have lost nearly six months of active judicial service. Third, there may be gaps between demand and supply in particular localities because of the way in which judicial resources are deployed geographically. Although the total number of magistrates may be adequate to meet state-wide demand, spatial gaps can arise because judicial resources are not located where they are most needed. This is a special challenge for a Court that sits in 150 locations throughout the state.
5. Conclusion
This is believed to be the first published study in Australia to make projections of the future workload of a court on the basis of the changing demographics of the Australian population. As already noted, the study does not attempt to model all the determinants of the court’s workload but seeks to isolate and analyse the impact of population dynamics.
The choice of the New South Wales Local Court as the subject of the study is significant. Not only are magistrates’ courts ‘the only courts that the vast majority of people are likely to have to face’,[35] but the Local Court is by far the largest court in Australia. Nevertheless, the conclusions cannot necessarily be extrapolated to other New South Wales courts or to the magistrates’ courts in other states or territories, where different patterns of population growth, criminal conviction and judicial productivity may lead to differing assessments.
It will be apparent that there are a number of limitations to the study, which need to be borne in mind when interpreting the results. First, the study relies on historical data provided by a number of government agencies and is therefore subject to any gaps or errors inherent in those data. Reliable Australian data on courts and judges is scant and to a large degree the plea, a generation ago, of a former Chief Justice of Australia that ‘the Australian Statistician take up the challenge of maintaining wide-ranging data on the operation of Australian courts’ remains unfulfilled.[36] The study also relies on projected population data over the next 25 years and the reasonableness of the demographic assumptions that underpin those projections.
Secondly, the study does not seek to anticipate significant changes to the jurisdiction of the Local Court but assumes that the workload patterns reflected in the 2010 criminal conviction data will continue into the future. In fact, the jurisdiction of the Court has been dynamic, with significant increases in its jurisdiction over the years.[37] This has been a response, in part, to the increasing professionalisation of the magistracy,[38] and in part to the quest for greater economic efficiency in the administration of justice by pushing formerly indictable offences triable in a higher court by judge and jury into the domain of magistrates.[39] The Court’s future workload may diverge from the projections if there is significant additional growth in the Court’s jurisdiction, a shift in the mix of civil and criminal matters, or a change in the proportion of criminal matters that result in conviction.
Despite these limitations, demographic methods provide useful tools for analysing the challenges facing courts as a result of anticipated changes in the population. In the case of the New South Wales Local Court, those challenges arise from projected growth in the size of the state’s population, changes to its age-sex composition and spatial distribution, and from a projected ageing of the magistrate workforce which is likely to increase the need for replacement recruitment. The Local Court—whose workload is overwhelmingly criminal and whose operations necessarily extend to a large number of localities across the state—will need to be alive to these population dynamics if it is to maintain a workforce of sufficient strength to meet the projected work in the years ahead.
Figure 1: Conceptual model
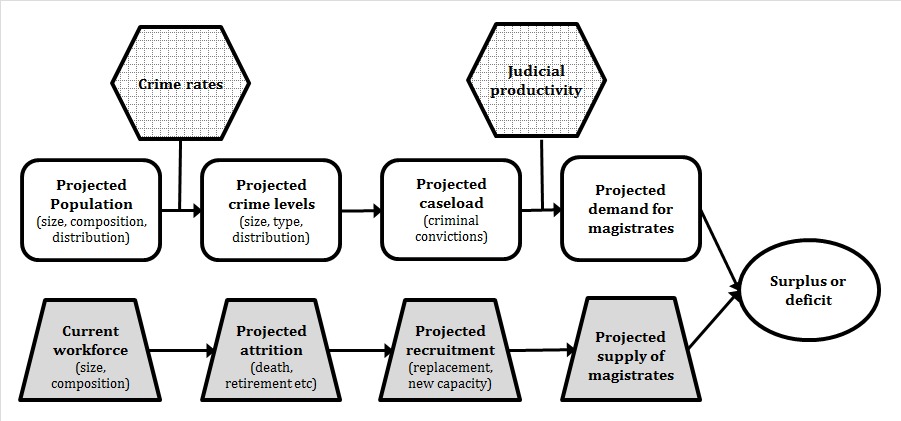
Figure 2: Projected growth of NSW Population, 2011–2036
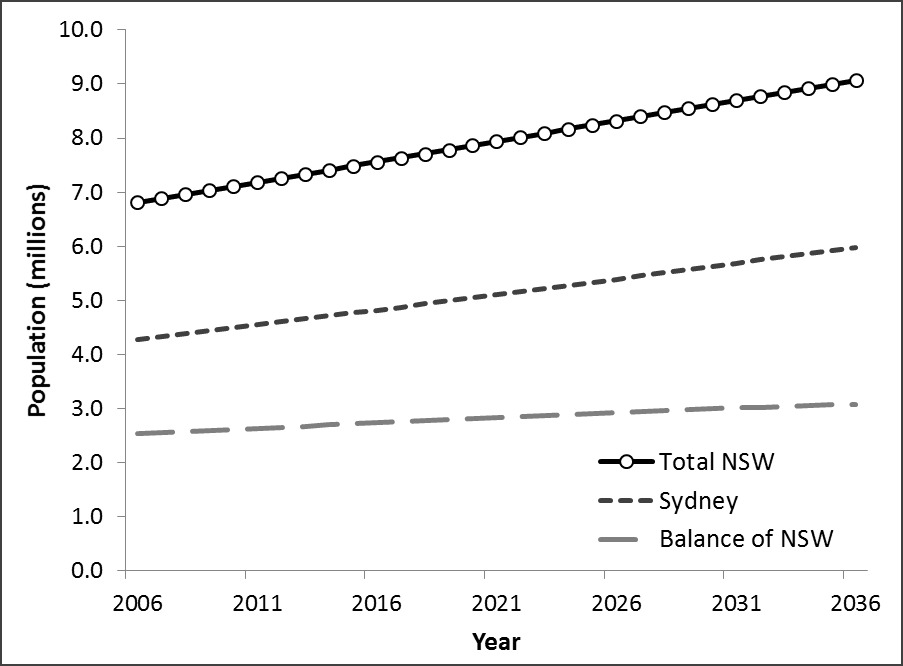
Source: NSW Department of Planning
Figure 3: Projected age–sex distribution of the population, NSW, 2011 and 2036
 |
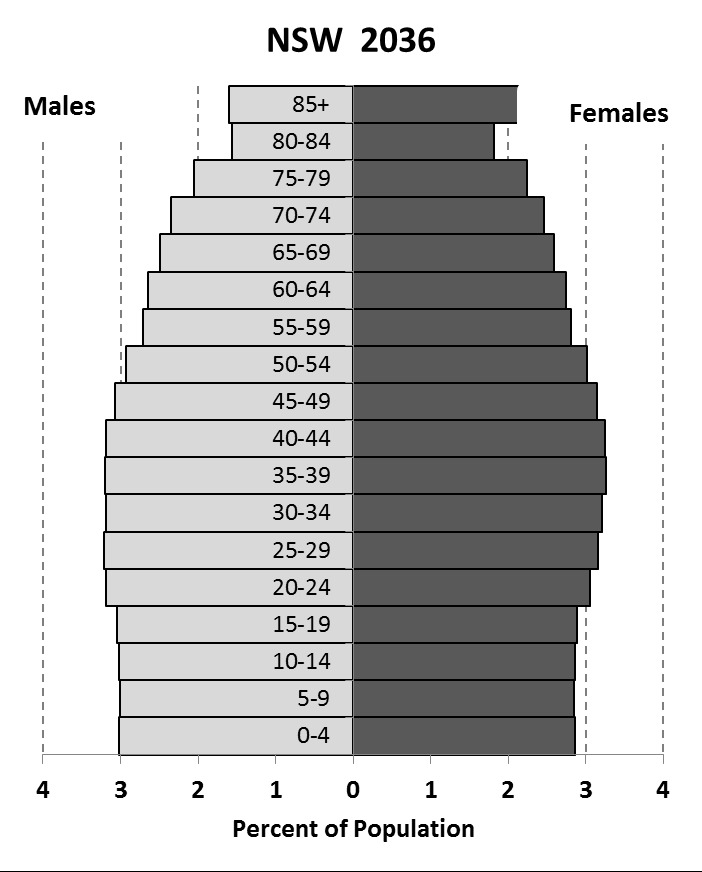 |
Source: NSW Department of Planning
Table 1 Persons convicted in NSW Local Court by principal offence, 2009–10
|
Principal Offence Category
|
Number
|
Percentage
|
|
Traffic and vehicle regulatory offences
|
44,198
|
41.6
|
|
Acts intended to cause injury
|
16,084
|
15.1
|
|
Illicit drug offences
|
8,015
|
7.5
|
|
Theft and related offences
|
6,032
|
5.7
|
|
Public order offences
|
4,933
|
4.6
|
|
All Other
|
26,959
|
25.4
|
|
Total
|
106,221
|
100.0
|
Source: NSW Bureau of Crime Statistics and Research
Figure 4. Criminal conviction rates by age and sex, NSW, 2010
Source: NSW Bureau of Crime Statistics and Research
Figure 5. Criminal conviction rates by age and type of principal offence, NSW, 2010
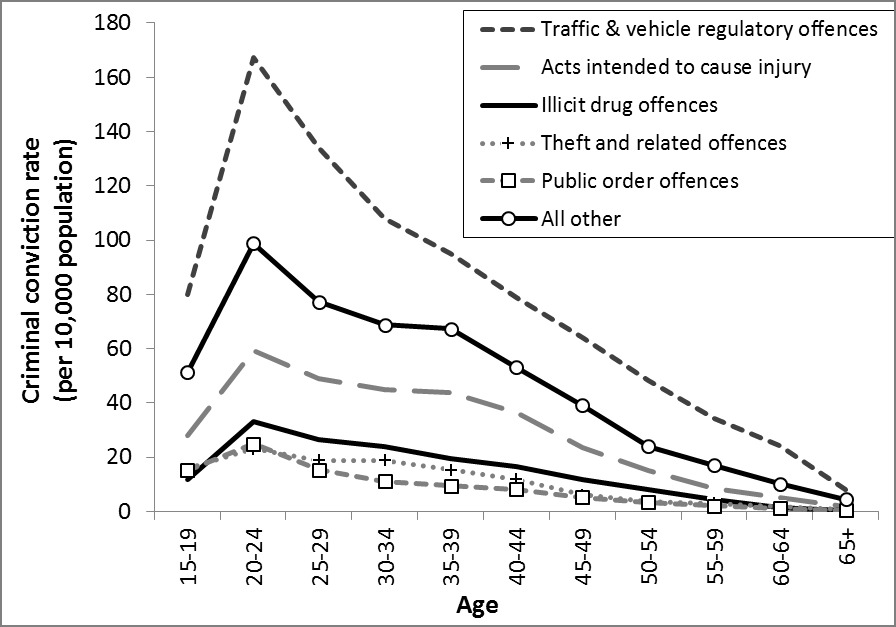
Source: NSW Bureau of Crime Statistics and Research
Table 2: Criminal conviction rates by location, NSW, 2010
|
Region
|
Crude Criminal
Conviction Rates (per 10,000 population) |
Age Standardised
Criminal Conviction Rates (per 10,000 population) |
|
Sydney: Statistical Subdivisions
|
123.2
|
116.2
|
|
Blacktown
|
168.0
|
158.3
|
|
Canterbury-Bankstown
|
144.2
|
141.9
|
|
Central Northern Sydney
|
64.3
|
66.8
|
|
Central Western Sydney
|
128.6
|
115.2
|
|
Eastern Suburbs
|
98.5
|
86.1
|
|
Fairfield-Liverpool
|
161.7
|
154.2
|
|
Gosford-Wyong
|
143.8
|
160.5
|
|
Inner Sydney
|
178.0
|
146.9
|
|
Inner Western Sydney
|
88.2
|
79.4
|
|
Lower Northern Sydney
|
59.6
|
54.9
|
|
Northern Beaches
|
88.1
|
90.2
|
|
Outer South Western Sydney
|
175.1
|
168.6
|
|
Outer Western Sydney
|
135.2
|
132.7
|
|
St George-Sutherland
|
98.0
|
95.5
|
|
|
|
|
|
Balance of NSW: Statistical Divisions
|
159.0
|
176.6
|
|
Central West
|
165.7
|
181.6
|
|
Far West
|
241.3
|
290.4
|
|
Hunter
|
148.0
|
156.5
|
|
Illawarra
|
136.4
|
148.3
|
|
Mid-North Coast
|
165.1
|
210.9
|
|
Murray
|
144.5
|
161.0
|
|
Murrumbidgee
|
189.1
|
198.0
|
|
Northern
|
190.0
|
212.1
|
|
North-Western
|
244.0
|
272.2
|
|
Richmond-Tweed
|
147.7
|
170.6
|
|
South Eastern
|
139.1
|
160.6
|
|
|
|
|
|
All NSW
|
146.9
|
143.7
|
Source: Derived from NSW Bureau of Crime Statistics and Research and NSW Department of Planning
Table 3: Projected number of magistrates by location, NSW, 2011–2036
|
|
2011
|
2016
|
2021
|
2026
|
2031
|
2036
|
|
Projected criminal convictions, all NSW
|
100,851
|
104,162
|
107,093
|
110,237
|
113,740
|
117,326
|
|
Index of demand for magistrates
|
100.0
|
103.3
|
106.2
|
109.3
|
112.8
|
116.3
|
|
Number of magistrates demanded
|
136.0
|
140.5
|
144.4
|
148.7
|
153.4
|
158.2
|
|
Demand by region (persons)
|
|
|
|
|
|
|
|
Sydney
|
|
|
|
|
|
|
|
Blacktown
|
7.0
|
7.7
|
8.5
|
9.3
|
10.0
|
10.7
|
|
Canterbury-Bankstown
|
6.5
|
6.7
|
6.8
|
7.0
|
7.2
|
7.5
|
|
Central Northern Sydney
|
4.1
|
4.4
|
4.6
|
4.8
|
4.9
|
5.0
|
|
Central Western Sydney
|
6.2
|
6.6
|
6.8
|
6.9
|
7.1
|
7.4
|
|
Eastern Suburbs
|
3.5
|
3.5
|
3.6
|
3.6
|
3.7
|
3.7
|
|
Fairfield-Liverpool
|
8.4
|
8.8
|
9.5
|
10.1
|
10.7
|
11.7
|
|
Gosford-Wyong
|
6.4
|
6.7
|
7.0
|
7.3
|
7.7
|
8.1
|
|
Inner Sydney
|
9.2
|
9.4
|
9.7
|
10.0
|
10.4
|
10.8
|
|
Inner Western Sydney
|
2.3
|
2.5
|
2.6
|
2.6
|
2.7
|
2.8
|
|
Lower Northern Sydney
|
2.6
|
2.7
|
2.8
|
2.8
|
2.9
|
3.0
|
|
Northern Beaches
|
3.0
|
3.1
|
3.2
|
3.2
|
3.3
|
3.3
|
|
Outer South-Western Sydney
|
6.6
|
7.6
|
8.6
|
10.0
|
11.4
|
12.3
|
|
Outer Western Sydney
|
6.2
|
6.4
|
6.7
|
6.9
|
7.2
|
7.5
|
|
St George - Sutherland
|
6.3
|
6.4
|
6.4
|
6.5
|
6.6
|
6.7
|
|
Sub-total
|
78.3
|
82.5
|
86.6
|
91.1
|
95.9
|
100.6
|
|
Balance of NSW
|
|
|
|
|
|
|
|
Central West
|
4.1
|
4.0
|
3.9
|
3.8
|
3.7
|
3.6
|
|
Far West
|
0.7
|
0.7
|
0.6
|
0.5
|
0.5
|
0.4
|
|
Hunter
|
13.3
|
13.6
|
13.8
|
14.0
|
14.2
|
14.5
|
|
Illawarra
|
8.2
|
8.4
|
8.4
|
8.5
|
8.6
|
8.7
|
|
Mid North Coast
|
7.1
|
7.2
|
7.1
|
7.1
|
7.1
|
7.2
|
|
Murray
|
2.4
|
2.3
|
2.2
|
2.2
|
2.1
|
2.1
|
|
Murrumbidgee
|
4.1
|
4.0
|
4.0
|
3.9
|
3.8
|
3.8
|
|
Northern
|
4.7
|
4.5
|
4.3
|
4.1
|
4.0
|
3.8
|
|
North-Western
|
3.9
|
3.8
|
3.6
|
3.4
|
3.3
|
3.1
|
|
Richmond-Tweed
|
5.0
|
5.2
|
5.3
|
5.4
|
5.5
|
5.6
|
|
South-Eastern
|
4.3
|
4.4
|
4.5
|
4.6
|
4.7
|
4.8
|
|
Sub-total
|
57.7
|
58.0
|
57.8
|
57.5
|
57.5
|
57.6
|
|
|
|
|
|
|
|
|
|
Grand Total
|
136.0
|
140.5
|
144.4
|
148.7
|
153.4
|
158.2
|
Source: Derived from NSW Bureau of Crime Statistics and Research and NSW Department of Attorney General and Justice
Table 4: Demand for magistrates in 2036 under different assumptions

Figure 6: Projected supply of magistrates, NSW, 2011–2036
Source: NSW Department of Attorney General and Justice (historical data)
Table 5: Workforce size, age, attrition and recruitment, NSW, 2011–2036

Source: Derived from NSW Department of Attorney General and Justice
[1] Productivity Commission, 'Report on Government Services' (Productivity Commission, 2013) Ch 7A, attachment tables.
[2] Kathy Mack, Anne Wallace and Sharyn Roach Anleu, Judicial Workload: Time, Tasks and Work Organisation (Australasian Institute of Judicial Administration, 2012) 33. The equivalent figure for Australian judges was 50 per cent.
[3] Russell Hogg, 'Punishment and the Courts in Rural Communities' in Elaine Barclay et al (eds), Crime in Rural Australia (Federation Press, 2007) 167, 172.
[4] Premier's Department of NSW, 'Workforce Planning: A Guide' (NSW Government, 2003) 8.
[5] Keith Fentress, 'Long-Range Facility Planning for Federal Courts' (2000) 9(3) Journal of Judicial Administration 134. See John Douglas, 'Examination of NCSC Workload Assessment Projects and Methodology 1996-2006' (National Center for State Courts, 2008) on the use of weighted caseload models to justify resource allocations in United States state courts.
[6] Steven Levitt, 'The Limited Role of Changing Age Structure in Explaining Aggregate Crime Rates' (1999) 37(3) Criminology 581; Lisa Rosevear, 'Australian Crime Trends and Population Ageing: A Quantified Perspective' (2007) 10 Flinders Journal of Law Reform 831; Lisa Rosevear, 'The Impact of Structural Ageing on Crime Trends: A South Australian Case Study' (2012) 431(February) Trends and Issues in Crime and Criminal Justice 1.
[7] Local Court of New South Wales, 'Annual Review 2011' (Local Court of New South Wales, 2012) 5, 13–19.
[8] J Baker, An Introduction to English Legal History (Butterworths, 2nd ed, 1979) 15–20.
[9] Local Court of New South Wales, above n 7, 5.
[10] There is a vigorous debate about whether larger populations experience higher crime rates in addition to larger crime volumes: see James Nolan, 'Establishing the Statistical Relationship between Population Size and UCR Crime Rate: Its Impact and Implications' (2004) 32(6) Journal of Criminal Justice 547; Mitchell Chamlin and John Cochran, 'An Excursus on the Population Size-Crime Relationship' (2004) 5(2) Western Criminology Review 119; Thomas Rotolo and Charles Tittle, 'Population Size, Change, and Crime in US Cities' (2006) 22 Journal of Quantitative Criminology 341.
[11] In some jurisdictions the legislature may have a direct say in the relationship between population size and the number of judicial officers. In Nevada, for example, the number of justices of the peace in a township is determined by a statutory formula: for counties of more than 400,000 people there must be one justice of the peace for each 100,000 population or fraction thereof. See Terri March, 'Planning for the Future: The Link between Caseload Growth and Rapid Population Increases' (National Center for State Courts, 2009) 29.
[12] New South Wales Department
of Planning, 'New South Wales Statistical Local Area PopulationProjections,
2006-2036' (NSW Government,
2010)
260-61.
[13] New South Wales
Bureau of Crime Statistics and Research, ref: cj11-10027.
[14] Australian Bureau of Statistics, 'Statistical Geography Volume 1: Australian Standard Geographical Classification (ASGC) July 2006, Cat No. 1216.0' (Commonwealth of Australia, 2006).
[15] Hilary Golder, High and Responsible Office: A History of the NSW Magistracy (Sydney University Press, 1991) 198–208.
[16] AH Pollard, Farhat Yusuf and GN Pollard, Demographic Techniques (Pergamon, 3rd ed, 1990) 117.
[17] Frank Notestein, 'Population: The Long View' in Theodore Schultz (ed), Food for the World (Chicago University Press, 1945) 36. For a discussion of the antecedent literature, see Brian O'Neill and Wolfgang Lutz, 'Projections and Forecasts, Population ' in Paul Demeny and Geoffrey McNicoll (eds), Encyclopedia of Population (Thomson Gale, 2003) 808.
[18] New South Wales Department of Planning, 'New South Wales State and Regional Projections 2006-2036' (Department of Planning, 2008).
[19] ibid.
[20] ibid.
[21] Graeme Hugo, 'Changing Patterns of Population Distribution in Australia' (2002) special issue Journal of Population Research and New Zealand Population Review 1, 1.
[22] Shane Nugent, 'Why Sydney Keeps Growing: Trends in Population Distribution in New South Wales 1991 to 1996' (1998) 6(4) People and Place 27.
[23] New South Wales Department of Planning, above n 18.
[24] Australian Bureau of Statistics, 'Australian and New Zealand Standard Offence Classification, Cat No 1234.0' (Australian Bureau of Statistics, 2011).
[25] Donald Rowland, Demographic Methods and Concepts (Oxford University Press, 2003) 119–42.
[26] Rosevear, above n 6 (‘Australian Crime Trends’); Rosevear, above n 6 (‘Impact of Structural Ageing’).
[27] Productivity Commission, 'Report on Government Services' (Productivity Commission, 2012) 7.62. See also the Data Quality Information (DQI) on ‘Judicial Officers’, 6–8.
[28] Productivity Commission, Productivity Primer <www.pc.gov.au/research/productivity/primer>.
[29] Jim Spigelman, 'Measuring Court Performance' (2006) 16 Journal of Judicial Administration 69, 70. See also Jim Spigelman, 'Quality in an Age of Measurement' (2002) 46(3) Quadrant 9.
[30] Productivity Commission, above n 1, 7.24.
[31] Mack, Wallace and Roach Anleu, above n 2, 166–70. For a review of United States experience, see Douglas, above n 5.
[32] Arthur Hoyle and Eugene Clark, 'The Court of the Future and Its Lessons' (2004) 12(4) Australian Law Librarian 45.
[33] Kerry Carrington, 'Crime in Rural and Regional Areas' in Elaine Barclay et al (eds), Crime in Rural Australia (Federation Press, 2007) 27, 42; Kerry Carrington and John Scott, 'Masculinity, Rurality and Violence' (2008) 48 British Journal of Criminology 641. This would affect the present analysis only if increased crime rates were reflected in increased rates of criminal conviction.
[34] Carsten Tank-Nielsen, 'Sensitivity Analysis in System Dynamics' in Jørgen Randers (ed), Elements of the System Dynamics Method (MIT Press, 1980) 187, 188; Alan Graham, 'Parameter Formulation and Estimation in System Dynamics Models' (Paper presented at the International Conference on System Dynamics, Geilo, Norway, 1976) 570–73.
[35] James Crawford and Brian Opeskin, Australian Courts of Law (Oxford University Press, 4th ed, 2004) 87.
[36] Garfield Barwick, 'The State of the Australian Judicature' (1977) 51 Australian Law Journal 480, 480.
[37] Graeme Henson, 'The Local Court Comes of Age' (2007) Summer Bar News 26; Graeme Henson, 'Twenty-Five Years of the Local Court of New South Wales' (2010) 22(6) Judicial Officers' Bulletin 45.
[38] John Lowndes, 'The Australian Magistracy: From Justices of the Peace to Judges and Beyond: Part I' (2000) 74 Australian Law Journal 509; John Lowndes, 'The Australian Magistracy: From Justices of the Peace to Judges and Beyond: Part II' (2000) 74 Australian Law Journal 592; Sharyn Roach Anleu and Kathy Mack, 'The Professionalization of Australian Magistrates: Autonomy, Credentials and Prestige' (2008) 44(2) Journal of Sociology 185.
[39] David Brown et al, Criminal Laws: Materials and Commentary on Criminal Law and Process in New South Wales (Federation Press, 5th ed, 2011) 228.
AustLII:
Copyright Policy
|
Disclaimers
|
Privacy Policy
|
Feedback
URL: http://www.austlii.edu.au/au/journals/UTSLRS/2014/1.html