
eJournal of Tax Research

|
|
Home
| Databases
| WorldLII
| Search
| Feedback
eJournal of Tax Research |
|
Abstract
This paper presents the results of research on the size and evolution of the informal economy and tax evasion in Croatia. It compares the results of two large-scale surveys of the informal economy and tax evasion, one conducted in 1996, covering the first half of the 1990s, and another conducted in 2001, covering the 1996-2000 period. Before conducting the second survey we expected the size of the informal economy and the extent of tax evasion in Croatia to be declining in response to positive economic and political changes in Croatia and the region in the second half of the 1990s. Most of our measurement methods confirm this null hypothesis. In particular, the system of national accounts method indicates that the size of the informal economy in 2000 was equivalent to about 7% of GDP, compared with an estimated 37% in 1993. However, the monetary evaluation method and the electricity consumption method suggest that the size of the informal economy increased somewhat in the second half of the 1990s. Such discrepancies are also common in empirical work in other countries and we investigate some possible reasons for the contrasting results in the case of Croatia. The paper first presents the key results of our surveys on the size of the informal economy and the extent of tax evasion; then discusses other evidence supporting our main finding on the decline in the size of the informal economy, including the results of research on the socio-cultural dimensions of the informal economy in Croatia, and finally gives some conclusions and provides some policy recommendations.
This paper presents the results of research on the size and evolution of the informal economy and tax evasion in Croatia during the second half of the 1990s. It compares the results of two large-scale surveys of the informal economy and tax evasion, one conducted in 1996, covering the first half of the 1990s, and another conducted in 2001, covering the 1996-2000 period.[1] Before conducting the second survey we expected the size of informal economy and the extent of tax evasion in Croatia to be declining as a result of positive economic and political changes in Croatia and the region in the second half of the 1990s. Most methods of measurement confirm this null hypothesis. In particular, the system of national accounts method (SNA) indicates that the size of the informal economy in 2000 was equivalent to about 7% of GDP, compared with an estimated 37% in 1993. However, the monetary evaluation methods and the electricity consumption method suggest that the size of the informal economy increased somewhat in the second half of the 1990s. Such discrepancies are common in empirical work for other countries and we investigate some possible reasons for the contrasting results in the case of Croatia. In particular, we consider the results of related research by sociologists from our team on the socio-cultural dimensions of the informal economy (see Štulhofer, 1999; Štulhofer and Rimac, 2002). This research indirectly provides convincing evidence of the decline in the size of the informal economy, which leads us to argue in the end in favour of the null hypothesis.
The remainder of this paper is divided in three sections. Key results of our surveys on the size of the informal economy and the extent of tax evasion are presented in Section 2. Section 3 discusses other evidence supporting our main finding on the declining size of the informal economy, including the results of research conducted by sociologists on the socio-cultural dimensions of the informal economy in Croatia. Section 4 concludes and provides some policy recommendations.
Figure 1 summarises seven different estimates of the size of the informal economy in Croatia during 1990-2000. The different methods are described below
|
Box 1
Methods of estimating the size of the informal economy and tax
evasion
|
We should first stress that empirical evidence for other countries also indicates wide discrepancies in the estimated size of the informal economy based on different methods. National accounts discrepancies methods usually give lower, while various monetary methods usually give higher results. Schneider and Enste (2000) compare results of various methods e.g. for Germany in the same period the discrepancy between expenditure and income resulted in an informal economy of 13 % GDP while the transactions approach resulted in 30%; for Italy in almost the same period the discrepancy between expenditure and income gave around 9%, while the cash-deposit ratio gave around 30%, and the transactions approach over 34% GDP.
In the case of our research in Croatia four of the seven methods indicate that the size of the informal economy continuously declined in the second half of the 1990s. The SNA method indicates the most significant reduction in the informal economy, from about 37% of GDP in 1993 to an estimated 7% of the GDP in 2000. The Eurostat method, which could be applied only to 1998 and 1999 because of the lack of data for other years, strongly coincides with the SNA method.
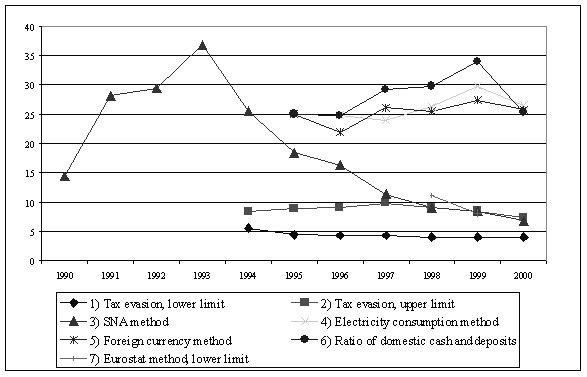
Source: Lovrinčević, Mikulić and Nikšić-Paulić (2002); Madžarević-Šujster (2002); Madžarević-Šujster and Mikulić (2002); Šošić and Faulend (2002).
Upper-and lower-bound estimates of the share of tax evasion in GDP provide evidence of the same trend, although they do not indicate such a large shrinkage of the informal economy as the former two methods. Nevertheless, these two estimates are particularly important because our survey indicates that labour not reported for the sake of evading the payment of taxes[2] is a major source of the informal economy in Croatia (Lovrinčević, Mikulić and Nikšić-Paulić, 2002).
Figure 2 compares the upper- and lower-bound estimates of the share of tax evasion in GDP with two alternative indicators that are expected to be positively correlated with the size of the informal economy: the size of the tax burden on the economy, defined as total tax revenue of consolidated general government in official GDP; and the estimated size of the informal economy. The tax burden indicator is clearly highly correlated with the upper-bound estimate of the extent of tax evasion, while the estimated size of the informal economy is highly correlated with the lower-bound estimate, thus confirming the initial result. One should note, however, that the lower limit estimate of missed revenue in 2000 (8.6 billion kuna) is still very large - it is greater for instance than the deficit of consolidated general government in 2000 (7.7 billion kuna).
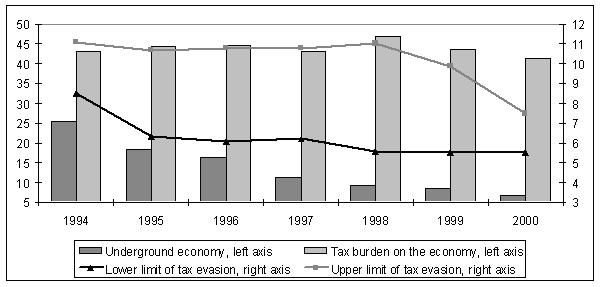
Source: Madžarević-Šujster (2002).
In summary, the SNA, Eurostat, and the (upper limit) tax evasion methods indicate that the informal economy in Croatia accounted for about 9% of GDP in 1998 and about 7% in 1999. The similarity of these estimates is in itself a remarkable result – that the three different methods yield almost identical estimates in two consecutive years would hardly seem to be a coincidence.
Yet measures of the informal economy using the ratio of domestic cash and deposits (C/M1), the so-called Gutmann method; the ratio of foreign cash in circulation and domestic monetary aggregate (FCC/M1); as well as the electricity consumption method suggest that the size of the informal economy increased more or less continuously from 1995 to 1999 and subsequently declined in 2000. Again, the three estimates are remarkably similar, but indicate that the informal economy was much larger in 2000, equivalent to about 25% of GDP. We must here stress that measurements with monetary methods in Croatia are in a way problematic because of the short time series and the unsatisfactory statistical basis (more about the shortcomings in Jankov, 1997 and Šošić and Faulend, 2002). Particularly important is that e.g. the Gutman method does not take into account the specific circumstances in a country like Croatia, i.e. experience of hyperinflation and frequent devaluations. As a consequence citizens are apt to turn their free resources into foreign currency and put them into short-term time deposits. This can not be considered real savings, rather delayed consumption stored in a currency that citizens trust more. If the share of cash in a somewhat wider monetary aggregate (between M1 and M4) had been used, i.e. if short-term time deposits were included, the results could have been different (the share of cash would probably have fallen). The electricity consumption estimates were criticized by Schneider and Enste (2000) because not all economic activities are equally electricity-intensive, while some service industries that are easier to conceal or switch into the informal economy are often labour intensive; technological advances that increase efficiency reduce the need for electricity, and electricity consumption elasticity compared with changes in GDP can change in some years. The method has also been criticized by Lacko (2003) and Eilat and Zinnes (2000).
Can these two sets of contrasting evidence be reconciled? We address this issue in three steps. First we consider macroeconomic trends in the 1990s. Second, we discuss how various special factors identified in recent literature are likely to have influenced the evolution of the informal economy in Croatia during the 1990s. Third, we look at evidence from a related survey on the socio-cultural characteristics of the informal economy.
Macroeconomic trends
In general, one would expect the size of the informal economy to increase as macroeconomic circumstances - growth, inflation and unemployment - deteriorate. See e.g. Eilat and Zinnes (2000) and Feige (2002, 2003).
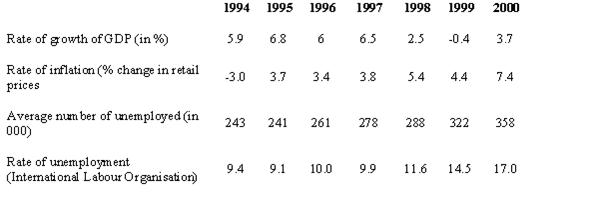
Sources: Ministry of Finance and State Statistical Office.
If we look at the data in the Table 1 we could argue the following:
| • | Strong economic growth in the mid-1990s and sharp slowdown in 1998-2000 would suggest a decline in the informal economy in the mid-1990s and its rise in the late 1990s. This conflicts with the evidence of the decline and supports the evidence of the growth of the informal economy. |
| • | Inflation was relatively low in the mid-1990s and rose in 1998-2000, which again argues in favour of the evidence of the growth and contrary to the evidence of the decline in the size of the informal economy. |
| • | Unemployment rose more or less continuously, which again speaks in favour of the evidence of growth of the informal economy. |
In summary, macro evidence would at first sight seem to point to conditions for an increase in the size of the informal economy in the late 1990s. However, additional macroeconomic evidence is not inconsistent with the estimated decreasing trends in the informal economy. As argued by Madžarević-Šujster and Mikulić (2002), economic stabilisation in 1994 and the rise in personal incomes in 1997 clearly led to a reduction in the estimated size of the informal economy. Higher incomes in particular led to a change in the structure of personal spending – spending on consumer durables, mostly financed with loans (which automatically reduce the possibility of concealing transactions) rose significantly in 1997 as a result of higher personal incomes. The consolidation of large retail chains and the entry of foreign firms into Croatia in the second half of the 1990s reduced the market share of small and informal enterprises, leading to better statistical reporting. In 1998 a value added tax with broad coverage was introduced, which considerably improved the registering of transactions due to built-in incentives for keeping neat records. Finally, in 2000 the government paid off a large proportion of its debts to enterprises; the banking sector was further consolidated; and banks started to increase lending to small- and medium-sized enterprises, all of which increased the incentives for reporting transactions. Thus, on balance we can conclude that macroeconomic evidence with some reservations is basically consistent with a decline in the size of the informal economy in the late 1990s.
Transition-related factors influencing the informal economy
The 1990-2000 periods in Croatia was marked by several specific factors that may have considerably influenced estimates of economic activity.
First, there were significant changes in the statistical system and many statistical series were discontinued. Second, high inflation in the early 1990s highly distorted the size of many economic variables. Third, numerous new business units were created that reported few if any data to the statistical office, while on the other hand large business systems with established statistical reporting procedures disappeared. The changes in the quality and scope of data between 1990-2000 therefore make it likely that the estimated size of the informal economy in the mid-1990s, when many of these changes were still occurring, was underestimated and that the estimated reduction in the size of the informal economy in the late 1990s reflects better coverage of the formal economy in the national accounts.
The literature somehow came to the understanding of some of the factors influencing informal activities in countries in transition. Political repression, inadequate legal system, institutional weaknesses, administrative control and discretional decision-making in the economy, high tax burdens and a non-payment culture are recognized by several authors Kaufman and Kaliberda (1996), North (1997), Vehovec (2001). All these factors became less pronounced in the late 1990s in Croatia and hence point to the decline in the size of the informal economy.
| • | Political repression certainly gradually started to phase out after the end of the war in the mid-1990s. |
| • | The legal system has been constantly improving (even if still not fast enough) with the introduction of numerous new laws and amendments to the existing ones (e.g. bankruptcy law, criminal law and various tax related laws). |
| • | Institutions improved during the time (e.g. tax and customs administrations were introduced, financial police established, central bank developed). Particularly influential was the privatisation of media and their liberalization, which played a great role in exposing the poor practices of the institutions. |
| • | Administrative control and discretional decision-making in the economy had to become less pronounced thanks to the liberalizations of markets, entrance to the WTO, and preparations for EU accession. |
| • | As shown before in Figure 2 the high tax burden decreased and tax evasion paralleled it. |
| • | Government started paying its liabilities, including arrears, which influenced the pro-payment culture. |
In particular, several factors that affect the growth of the informal economy in economies in transition were present in Croatia as well.
The transition intensified sectoral and institutional restructuring. As can be seen from Figure 3 in three chosen industries, for the whole of the decade, the ratio among them was the same – the informal economy is greater in trade, smaller in agriculture, and smaller still in industry. The trends, however, are essentially different: the UE is reducing in trade, stagnating in agriculture, but rising in industry. The explanation might be fairly simple – the speed of the transition per sector, the development of a number of new, mainly small business units and the number of employees, the relative weakening of the importance of the big systems. In short, the transition was most rapid in trade, slowest in industry – hence this kind of result. In agriculture there was no transition, hence the stagnation.
0
10
20
30
40
50
60
1990
1991
1992
1993
1994
1995
1996
1997
1998
1999
2000
Agriculture(upper limit)
Industry
Commerce (upper limit)
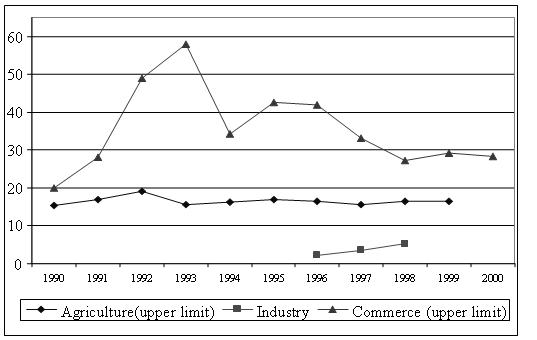
Source: Mikulić and Madžarević (2002).
Transition also created significant changes in the tax system. The majority of new tax laws were passed and new taxes were introduced during the early and mid-90s when Croatia simultaneously had to make the transition and carry on the war. Tax authorities had to cope with the new taxes and the increased numbers of taxpayers. Taxpayers took advantage of the opportunity of constant changes and lack of organized authorities. With the introduction of the tax administration, customs administration and financial police in the mid-90s situation had to improve in the direction of a diminution of informal activities.
Croatia’s transition also had some specific features. The most significant was the break-up of the former country and the establishment of the new state. As a result, numerous “soft borders” between the former Yugoslav republics were created. The end of the war, the establishment of new and better functioning customs authorities at borders, the conclusions of bilateral agreements with neighbouring countries all made for a less friendly environment for informal activities.
The war that followed the break-up of former Yugoslavia had serious social consequences; in particular it created a huge number of displaced and disabled persons. It took some time for majority of them to settle and fit into the formal environment.
The non-transparent process of privatisation catering to various special interests (the so-called clienteles) delayed the establishment of competitive market conditions. With the growth of domestic economic entities, openings for foreign players in the privatisation game, the space for special domestic players narrowed.
Socio-cultural factors
In addition to macroeconomic and transition-related factors, evidence from research conducted by sociologists from our team also points to conditions that are conducive to reduced role of the informal economy in the late 1990s. Štulhofer and Rimac (2002) start off from the theoretical assumption that the dynamics of social opportunism coincides with the dynamics of the informal economy: the rise in opportunism reduces the moral costs of engaging in informal economic activities, i.e. increases the readiness of individuals to get round or break the standards of economic behaviour. And if such informal activities go unpunished, they may sustain the expansion of opportunism on their own.
|
Box 2
Socio-cultural dimension of the informal economy
Using “World Values Survey 1995 and European Values Survey 1999 data
for Croatia" the authors analyse the dynamics of opportunism
and lack of trust
in institutions regarding them to be socio-cultural proxies of (the acceptance
and volume of) the informal economy,
measuring:
|
In this context, it is worthwhile to highlight the following findings of the two surveys on the socio-cultural dimensions of the informal economy and tax evasion in Croatia that were conducted in 1996 and 2001:
The diffusion and intensity of opportunism (see Box 1 for definitions) decreased from 72% in the mid-1990s to 48% in 2000.
| • | The number of respondents who think that tax evasion and bribing can never be justified doubled. |
| • | Economic traditionalism ceased to be a relevant factor. Respondents were getting used to differences in wages and, as it seems, embraced the principle of individual responsibility. |
One should note, however, that almost half of respondents were prepared to tolerate tax evasion and bribing phenomena in certain circumstances. Moreover, the distribution of opportunism according to age has remained unchanged, with the youngest age group still most apt to justify tax evasion and take bribes. This suggests that the phenomenon of opportunism might remain present in Croatia in the long term.
The evidence presented in this paper suggests that, on balance, the size of the informal economy and the extent of tax evasion declined in Croatia in the second half of the 1990s. One should note, however, that changes in the quality and scope of statistics during the past ten years make it difficult to assess the trends in informal economic activity with much certainty. Further research will therefore be necessary to provide better insight into the scope and dynamics of informal activities.
One area that needs to be explored in particular is “moonlighting” i.e. the labour that is not registered for economic reasons (subjects are not registered, so-called T5 in accordance with OECD, 2001) which seems to be an important component of the informal economy according to Lovrinčević, Mikulić and Nikšić-Paulić (2002). As the process of transition goes on, we can expect a reduction of the share of “moonlighting” and an increase in the amount of underreporting. This fact could have serious implications both for policy makers and for further researchers.
Another potentially important policy implication is that the extent of informal activity seems to be inversely related to the speed of transition and privatisation in particular. Thus, in retail trade, where the transition to a market-based system is essentially completed, there is clear evidence that the extent of informal activities has diminished. Policymakers should be prepared for the fact that with the eventual progress in privatisation of the agriculture for example we could expect first the parallel growth of the informal activities in that sector and later their decline.
One finding in this paper that has a bearing on economic policy is the need to improve the statistical system and to reform the tax system. Of particular importance would be to simplify the tax system and to improve the efficacy of the tax authorities. Because of the many changes in the tax system in the last couple of years it is necessary to try to ensure a more neutral tax system that will to the least possible extent influence economic decision making and in which the tax bases will be as broad as possible, with as few exemptions and privileges as possible, with the tax system not being used to carry out governmental social, economic and development policies. This means no additional tax concessions, credits, and allowances for individual industries, regions or occupations. On the contrary, the aim should be to abolish the existing privileges. The tax system should be as stable as possible, the tax and regulatory burden as low as possible, together with an increase in the probability of tax evasion being detected and penalised, with a build up of an appropriate public spending structure and quality of public services, and a strengthening of the general awareness of the need to pay taxes. As stressed by Madžarević-Šujster (2002) it is easy to make a decision about going into the informal activity in an unstable environment while for getting out of it a number of positive reforms and a relatively long period of time are required. It is not enough just to introduce fines. Large penalties do reduce the attractiveness of getting into informal activities, but an increase of revenue from fines shows that the system is in a bad condition. It is more important to obviate the causes than to penalize the consequences. The institutional sphere is crucial – the relationship of the government and the economy, i.e. the speed with which the government redefines its role in the market.
Bićanić, I. and Ott, K. 1997, The Unofficial Economy in Croatia: Causes, size and consequences [online]. Occasional Paper, No. 3. Available from: <http://www.ijf.hr/eng /ops/ijf-ocp3.pdf>
Blades, W. D. 1982, ‘The Hidden Economy and the National Accounts’. OECD Economic Outlook, Occasional Studies, (2), pp. 28-45.
Eilat, Y. and Zinnes, C. 2000, ‘The Evolution of the Shadow Economy in Transition Countries: Consequences for economic growth and donor assistance’. CAER II Discussion Paper, No. 83.
Eurostat, 1995, European System of Account. Luxembourg: Eurostat.
Feige, E. 2002, ‘Dollarisation and the Dynamics of the Unobserved Economy: What Have we learned from a Decade of Transition?’. Paper presented at the Institute of Public Finance international Conference ‘Unofficial activities in transition countries: Ten years of experience’, Zagreb, October, 2002.
Feige, E. 2003, ‘The Dynamics of Currency Substitution, Asset Substitution and de facto Dollarisation and Euroisation in Transition Countries’. Comparative Economic Studies (Fall).
Feige, E. and Ott, K. 1999, Underground Economies in Transition: Unrecorded activity, tax evasion, corruption and organized crime, Ashgate: Ashgate Publishing Ltd.
Gutmann, P. M. 1977, ‘Subterranean Economy’. Financial Analyst Journal, (November/December), pp. 26-34.
Jankov, Lj. 1997, ‘Monetaristički oblik neslužbenog gospodarstva’. Financijska praksa, 21 (1-2), pp. 157-168.
Kaufmann, D. and Kaliberda, A. 1996, `Integrating the Unofficial Economy into the dynamics of Post-Socialist Economies: A framework of analysis and evidence’. World Bank Working Paper, No. 1691. Washington: World Bank.
Lacko, M. 2003, Hidden Economy in East-European Countries: the impact of taxes and corruption (manuscript).
Lovrinčević, ŽMikulić, D. and Nikšić-Paulić, B. 2002, ‘The Official Statistics Approach to an Estimate of the Size of the Underground Economy’ [online]. Paper presented at the Institute of Public Finance international Conference ‘Unofficial activities in transition countries: Ten years of experience’, Zagreb, October, 2002. Available from: <http://www.ijf.hr/UE_2002/lovrincevic-mikulic-niksicpaulic.pdf> .
Madžarević-Šujster, S. 2002, ‘An Estimate of Tax Evasion in Croatia’ [online]. Occasional paper, No. 13. Available from: <http://www.ijf.hr/ops/PDF/ijf-ocp13.pdf> .
Madžarević-Šujster, S. and Mikulić, D. 2002, ‘An estimate of the underground economy via the national accounts system’ [online]. Paper presented at the Institute of Public Finance international Conference “Unofficial activities in transition countries: Ten years of experience”, Zagreb, October, 2002. Available from: <http://www.ijf.hr/UE_2002/ madzarevicsujster-mikulic.pdf> .
North, D. 1997, ‘The Contribution of the New Institutional Economics to an Understanding of the Transition Problems’. WIDER Annual Lecture, No. 1. Helsinki: Elsevier.
OECD, 2001, Handbook for Measurement of Underground, Informal and Illegal Activities (Non-observed Economy). Paris: OECD.
Ott, K. 2002, ‘The Underground Economy in Croatia’ [online]. Occasional Paper, No. 12. Available from: <http://www.ijf.hr/ops/PDF/ijf-ocp12.pdf> .
Schneider, F. and Enste, D. 2000, ‘Shadow Economies Around the World: Size, causes and consequences’. IMF Working Paper, WP 26/02. Washington: International Monetary Fund.
Šošić, V. and Faulend, M. 2002, ‘Dollarisation and the Underground Economy: Accidental partners?’ [online]. Occasional paper, No. 15. Available from: <http://www.ijf.hr/ops/PDF /ijf-ocp15.pdf>
Štulhofer, A. 1999, “Between Opportunism and Distrust: Socio-Cultural Aspects of the Underground Economy in Croatia” in E. Feige and K. Ott. Underground Economies in Transition: Unrecorded Activity, tax evasion, corruption and organized crime. Ashgate: Ashgate Publishing Ltd, pp. 43-63.
Štulhofer, A. and Rimac, I. 2002, ‘Opportunism, Institutions and Moral Costs: the Socio-Cultural Dimension of the Underground Economy in Croatia 1995-1999’ [online]. Occasional Paper, No.14. Available from: <http://www.ijf.hr/ops/PDF/ijf-ocp14.pdf>
Vehovec, M. 2002, ‘The Informal Economy and Informal Standards of Behaviour: How Much Ethics Can Help in Business Conduct’ [online]. Paper presented at the Institute of Public Finance international Conference “Unofficial activities in transition countries: Ten years of experience”, Zagreb, October, 2002. Available from: <http://www.ijf.hr/UE_2002/vehovec .pdf> .
[∗] Director, Institute of Public Finance, Zagreb, Croatia.
[1] More about the 1996 project could be found in Bićanić and Ott (1997) and in Feige and Ott (1999). Besides, all the papers from 1996 project were presented at the conference The Importance of the Unofficial Economy in Economic Transition organized by the Institute of Public Finance in Zagreb, in May 1997 and are available on request from the author of this paper. A brief overview of the 2001 project can be found at Ott (2002), but all the papers from the 2001 project were presented at the conference Unofficial Activities in Transition Countries: Ten Years of Experience organized by the Institute of Public Finance and Friedrich Ebert Stiftung in Zagreb, in October 2002 and can be found at [http://www.ijf.hr/eng/UE%202002/croatian.html].
[2] Estimate of tax evasion was given on the basis of selected direct (personal income, surtax and social security contributions, corporate income) and indirect (value added, excise on tobacco) taxes.
AustLII:
Copyright Policy
|
Disclaimers
|
Privacy Policy
|
Feedback
URL: http://www.austlii.edu.au/au/journals/eJlTaxR/2004/6.html