
Journal of Australian Taxation

|
|
Home
| Databases
| WorldLII
| Search
| Feedback
Journal of Australian Taxation |
|
REFLECTIONS ON PROVIDING TAX INCENTIVES FOR RESEARCH AND DEVELOPMENT: NEW ZEALAND AT THE CROSS ROADS
By Adrian Sawyer[∗]
The debate over the effectiveness of tax incentives to stimulate research and development (“R&D”) expenditure has been with us for several decades. The literature is extensive although far from conclusive on the desirability of fiscal incentives for R&D and the measurement of their incremental impact. New Zealand has lagged most members of the OECD in providing fiscal stimuli for R&D expenditure. It was only in the last few years that the tax treatment of R&D was brought largely into line with the financial accounting treatment, permitting further areas of “black hole” expenditure to be deductible for tax purposes. This article provides an overview of the R&D tax incentives for six OECD members that justify consideration by New Zealand, provides a summary of major research findings on the effectiveness of R&D incentives, subsidies and grants, and sets out by way of conclusion recommendations for future consideration, specifically for New Zealand policymakers.
The objective of this article is to assess the implications of providing tax incentives for research and development (“R&D”) expenditure focusing on the situation in New Zealand, within the context of an international comparison. New Zealand has taken some tentative steps in the last few years to improve the tax treatment of R&D expenditure but has yet to fully embrace substantive change to make its R&D tax regime more internationally competitive. New Zealand is in effect “at the cross-roads” in terms of choosing which path (or paths) it should follow to encourage further investment in R&D,[1] such as incentive deductions, subsidies (or tax credits), or grants.
Section 2 of this article provides a review of taxation law in a selection of Organisation of Economic Cooperation and Development (“OECD”) countries with respect to R&D, including those with common law and civil law systems. This brief review identifies appropriate overseas examples applicable for consideration in New Zealand, with key aspects of the taxation law regarding R&D expenditure in these countries summarised.
Section 2 also assesses accounting practice with respect to R&D expenditure, where it is ascertainable. Consideration of accounting practice is important as in countries with common law (in contrast to civil law) jurisdictions the tax and accounting systems differ, whereas in civil law jurisdictions they are much more closely linked. For example, in Australia there is a 125% (previously 150%) tax incentive for R&D expenditure but there are no restrictions on the 25% (previously 50%) above actual expenditure and thus it can be spent on things other than R&D. Furthermore, Section 2 provides information, where ascertainable, on the history of tax incentives for R&D and how these have changed, including the motivation behind these changes, as this assists with revealing the context of the change and thus its potential effectiveness.
Section 3 provides some detail on the impact of tax breaks on the level of R&D expenditure. While it was originally envisaged when undertaking the study that information could be obtained partly through examination of selected case studies of R&D regimes, including analysing selected company accounts to assess the expenditure on R&D over time and how changes in taxation rules have influenced this, such information was not readily ascertainable from a small sample of company accounts that were examined. R&D is not usually a separate item that is required to be identified (the exception being the United States) and in fact it may comprise a number of different types of expenses. Hence it also has not been possible to review New Zealand data to assess the change in R&D expenditure over time alongside the taxation rules.
Section 3 nevertheless provides some analysis of the effectiveness of changes in R&D expenditure on output from international experience, using summaries of overseas studies. While this study was not able to examine directly whether tax breaks encouraging links between private sector and public sector organisations (the private sector obtaining a tax break and the public sector organisation (including universities) receiving additional resources) has been effective in increasing the level of research expenditure, several jurisdictions have mechanisms in place to encourage such partnerships.[2]
Section 4 contains further discussion on the issues raised in Sections 2 and 3, with Section 5 offering concluding comments and recommendations for consideration by policymakers and other researchers.
The OECD currently comprises 30 member countries and as the first part of this study, a brief overview was undertaken primarily of the tax treatment of R&D expenditure of all 30 OECD members plus Singapore, with the regimes in six countries reviewed in this article. The six regimes were selected on the basis that relevant specific information was able to be obtained from public sources, and aspects of the regimes were considered pertinent to New Zealand’s current situation. All six countries’ R&D as a percentage of GDP in 1999 (the latest available data) was considerably higher than that for New Zealand. In addition information on the accounting treatment of R&D is presented where information was able to be obtained through the literature searches.
In civil law countries, the taxation and accounting systems are essentially integrated and hence there is no significant difference in the treatment of R&D for tax and accounting purposes. In many common law countries, this is also true, except for where tax incentives are provided, such as for accelerated deductions and accelerated depreciation of capital assets.
As an introductory observation, New Zealand’s position in terms of general expenditure on R&D does not fare well in comparison to many other OECD nations, falling well below the average. In fact, New Zealand was firmly placed in the bottom quarter of OECD nations for R&D as a percentage of GDP in 1989, rising to be within the bottom third in 1999. It is of interest to note that the majority of countries below NZ in 1999 are newer members of the OECD.
This Section provides an overview of the current New Zealand system, followed by a review of six OECD member countries’ R&D tax incentive systems that have characteristics of particular relevance for consideration by New Zealand tax policymakers.
Under rules introduced in 2001, businesses are allowed a full (100%) deduction for most expenditure on R&D, except to the extent that an asset is created. To maximise the deductibility of R&D costs, businesses must apply Financial Reporting Standard 13: Accounting for Research and Development Activities (“FRS 13”), as the basis for reporting on R&D work. These rules allow for R&D costs to be expensed until an asset recognition test is met.[3]
Deductibility for R&D expenditure is primarily governed by
s DJ 9A of the New Zealand Income Tax Act 1994 (“ITA 1994”) now ss DB 26 and DB 27(1) of the Income Tax Act 2004 (“ITA 2004”) (as from 1 April 2005 for most taxpayers). The meaning of R&D for tax purposes may be modified by Order in Council – see
s DJ 9B of the ITA 1994 (now s DB 27(2) of the ITA 2004), while deductibility for scientific research expenditure is covered by s DJ 9 of the ITA 1994 (now s DB 25 of the ITA 2004). Interestingly, while there is separate legislative treatment of this expenditure, which is attributable to the differences in expenditure that falls within the definition of each term, the tax characteristics are similar (albeit the definition for scientific expenditure is more straightforward).
The five asset recognition criteria impose a relatively high threshold before a cost needs to be capitalised. Practically, a R&D project will be well down the track before the criteria can be met. One of the criteria requires the developers of the product or process to demonstrate its technical feasibility. This is a more rigorous test than having confidence in the future of the idea. For many new ideas, the product or process development will be well-progressed before technical feasibility can be established.
Some business expenditure will not fall within the accounting standard definition of “research and development”. These business expenses must be considered in the light of the normal tax deduction rules to decide whether the costs incurred are capital or revenue in nature, such as s BD 2(1) and (2) of the ITA 1994 (now ss DA 1 – DA 4 of the ITA 2004) (general deductibility) and Pt EG of the ITA 1994 (now mainly Pt EE of the ITA 2004) (depreciation provisions).
The Private Sector R&D Liaison Group (“Liaison Group”) has asked the New Zealand Government to consider a number of areas including:
| 1. | The lack of guidance from the Inland Revenue Department (“IRD”) about the interface between the tax and accounting rules. |
| 2. | The inability to depreciate capitalised R&D expenditure unless it falls under the depreciation rules or is “fixed life intangible property”. |
| 3. | The non-deductibility of “black hole” expenditure. Black hole expenditure occurs when a business incurs R&D costs which are capitalised, but the project is subsequently abandoned or scaled back because it is less successful than originally anticipated. |
| 4. | The denial of a tax deduction for taxpayers who choose, for non-tax reasons, to capitalise R&D costs. The decision to capitalise may be made in response to requests from a bank or a parent company. Alternatively, the business owners may want to present a strong asset position to potential investors. Unless R&D costs are recognised as a business expense in the financial statements, no tax deduction is available. |
| 5. | Smaller companies that do not use the accounting standards (through operation of differential reporting) to report on R&D are unable to get a tax deduction under the special R&D rules. For these businesses, the R&D costs must meet the general tax deductibility criteria for a deduction to be claimed. |
| 6. | The current tax rules interface with the financial reporting standards, particularly FRS 13 which is the basis for the R&D definitions. As New Zealand moves to align its financial reporting standards with the International Financial Reporting Standards (“IFRS”), changes may be required. Alterations to FRS 13 may impact on the definitions and, as a consequence, the tax treatment of R&D expenditure. |
The New Zealand Government has been working with this Liaison Group to look at the workability of the current R&D rules and to identify areas of concern, with minor progress made including provisions to encourage more venture capital into New Zealand. Overall, there is a general lack of definitions in the R&D area. This omission, together with the varying treatment for taxpayers using different reporting regimes, has created uncertainty.
Amendments have been proposed as part of the Taxation (Depreciation, Payment Dates Alignment, FBT and Miscellaneous Provisions) Bill 2005 (NZ) to allow taxpayers to allocate certain R&D tax deductions to income years after the year in which the related expenditure (including a depreciation loss) is incurred. This means that deductions will not be lost if there is a shareholding change through the introduction of new equity investors between when the expenditure is incurred and when the deduction is recognised by the taxpayer. This tax treatment will be optional. However, those who choose this approach must allocate R&D deductions against income resulting from R&D expenditure. These changes are proposed to apply for the 2005-2006 income year.
A summary follows of six countries systems that have sophisticated R&D tax policies, aspects of which could be considered for exploration in the New Zealand context,[4] namely Australia, Canada, Japan, the Netherlands, the United Kingdom and the United States.[5]
Currently Australia offers a deduction equal to 125% of R&D current expenditures (previously this was 150% until June 1996); that is, an extra 25% deduction over and above the actual expenditure. The scheme commenced in 1985 with the aim of improving Australia’s investment in R&D. It was intended to be temporary only, originally due to expire in 1991. In summary, in order to qualify for the 125% deduction, annual R&D current or capital expenditures must generally exceed A$20,000. Subject to the same minimum expenditure threshold applicable to R&D current expenditures, Australia allows 125% of the amount of R&D capital expenditures to be written off over three years on a straight-line basis. R&D is generally defined as core technology/part of core activity. There is no restriction or limit placed on how the tax benefit of the R&D expenditure may be utilised, although it is anticipated that some of it at least will be utilised for further R&D.
The tax concession provides a concessional deduction for all eligible R&D expenditures of 125%. Current expenditure may be deducted at a rate of 125% of costs in the year in which it is incurred. Current costs include wages, salaries and other labour costs directly related to R&D activity, and contracted R&D with registered research agencies. Interest on debt and non-consumed feedstock in pilot plants were allowable elements in current expenditure up until June 1996, but have now been barred as deductions at the concessional rate.
Equipment used for R&D may be depreciated over three years and deducted at a rate equal to 125% of the deduction that would otherwise apply. Pilot plant will be written off over its useful life to a maximum of 125% of its cost (whereas prior to the 1996 amendments, pilot plant was written off over three years at 150%). Any company wishing to make an R&D claim to the Australian Taxation Office (“ATO”) must be registered with the Industrial R&D Board. Application for registration with the Industrial R&D Board must be made within six months of the end of the financial year in which the R&D expenditure was incurred.
Deductions for core technology expenditure are to be limited to one-third of the expenditure per annum on eligible R&D relating to that core technology. Amounts not deducted in the year of income will be available for deduction in later years if there is further related eligible R&D expenditure (whereas prior to the amendments in 1996, core technology purchases were immediately expensed at 100%). Buildings used for R&D may be depreciated over the standard period of 40 years, but with no other concessional treatment (although prior to 1987 buildings dedicated to R&D could be depreciated over 3 years at 150%).
The expenditure threshold for qualification for the full 125% tax deduction is A$20,000 (A$50,000 prior to May 1994). Furthermore, there must be a high degree of technical risk – that is, there must be some uncertainty over what the results of the R&D will be. The expenditure must be on innovation – with an appropriate level of novelty. The work must, in main, be carried out in Australia, with adequate Australian content. For example, the key personnel and the major items of plant and equipment must be Australian.
The requirement that taxpayers must register for R&D activities with the Industrial R&D Board to qualify for the R&D deduction is set out in ss 73B to 73Z of the Income Tax Assessment Act 1936 (Cth), which deal with the R&D deduction. Special rules by way of an exception to the general rule apply if the company does not have money at risk, whereby the deduction is limited.[6]
From 30 June 2001 a taxpayer can deduct an extra 50% on top of the bonus deduction if the incremental levels of R&D are greater than the three year average. This feature was introduced to encourage companies to look at R&D as a long term strategy, as a critical and ongoing part of business strategy. This would support successful management of R&D.
The definition of R&D eligible for the concession is similar to that given in the OECD’s Frascati Manual. There is also a need for detailed records of all expenditure, with the plan for R&D expenditure and investment needing to be maintained in order to claim the deduction. There is also a claw back provision in the case that the company receives a government grant. A company is not eligible for the credit if it is carrying out R&D on behalf of another company, thereby restricting double deductions. The entity that is permitted to claim the deduction is determined by who bears the financial risk. Small companies are allowed a R&D tax offset equivalent to the above concessions.
The current Canadian system was established in 1986. The amount of R&D expenditure is fully deductible and there are also tax credits. Claimants can apply for Scientific Research and Experimental Development (“SR&ED”) investment tax credits for expenditures such as wages, materials, machinery, equipment, some overhead, and SR&ED contracts. To qualify for the SR&ED program, work must advance the understanding of scientific relations or technologies, address scientific or technological uncertainty, and incorporate a systematic investigation by qualified personnel.
Work that qualifies for SR&ED tax credits includes: experimental development to achieve technological advancement to create new materials, devices, products, or processes, or improve existing ones; applied research to advance scientific knowledge with a specific practical application in view; basic research to advance scientific knowledge without a specific practical application in view; and support work in engineering, design, operations research, mathematical analysis, computer programming, data collection, testing, or psychological research, but only if the work is commensurate with, and directly supports, the eligible experimental development, or applied or basic research.
The following activities are not eligible for benefits under the program: social science and humanities research; commercial production of a new or improved material, device, or product, or the commercial use of a new or improved process; style changes; market research or sales promotion; quality control or routine testing of materials, devices, products, or processes; routine data collection; prospecting, exploring, or drilling for or producing minerals, petroleum, or natural gas; and development based solely on design or routine engineering practice.
The Department of Finance Canada and Revenue Canada’s 1998 report[7] provides a detailed evaluation of the Canadian tax credit system, including its administration, issues for evaluation, methodologies employed, and the overall performance of the incentives. The tax credit in Canada is 20% for all R&D (increased to 35% for Small and Medium Enterprises (“SMEs”)). This 35% refundable tax credit that is available to smaller Canadian-controlled private corporations has no equivalent in the United States.
For the 2003 financial year, reforms to the R&D tax credit and IT investment incentives have occurred to improve the competitiveness of the Japanese industry.[8] Japan has introduced a proportional credit rather than the existing incremental credit. A range of 8-12% is available, depending on such things as SME status, and joint public and private ventures. In addition an accelerated depreciation rate of 50% will apply for the 2003-2005 years.
Currently there is a credit of 20% given for the excess of the R&D expenses over those of the previous years. In any event, the credit is limited to 10% of the corporation tax. There is no carry-forward provision if the company is making a loss.
Japan also has a 5% basic technology tax credit for depreciable assets used in connection with the R&D of advanced technologies, and a credit for R&D carried out by SMEs of 6% which may be claimed instead of the incremental credit. To encourage R&D, Japan has recently introduced a new tax credit for special R&D expenditure. The 6% tax credit is allowed on total expenditure incurred in collaborative research undertaken in co-operation with a national research institution, foreign research institution or with a university.
Fiscal measures are utilised to reduce the wage tax and national insurance contributions. It is applied to wages paid and workers conducting R&D, reducing wage tax and national insurance contributions rather than corporate income tax. R&D projects must be approved by the Government and this form of support accounts for about 70% of that provided by the Government.
The deduction is equivalent to 40% of the remuneration of the relevant employees for the first part of their remuneration and 13% for the second part. New companies receive a 70% deduction instead of the 40%. However, the total deduction is capped. The company has to apply in advance, giving a description of the R&D project. The Revenue Authority/Government is not responsible for this, rather an independent agency is, namely SENTER. The R&D expenditure must be new for the applicant. The new legislation covers contracting of R&D to (semi-) public research institutes and foundations, with the explicit intention that the benefits of the R&D allowance enjoyed should be passed on to the customer.
R&D only needs to be technically new from the applicant’s point of view. It is too difficult to define this in societal terms. Thus one only needs to keep track of what the company has done in the past. This also spreads the risks of bankruptcy among companies and the difficulties in picking one entity. Redoing research originally conducted by another company can still provide improvements.
The need for pre-approval of R&D eliminates uncertainty regarding eligibility. It also has an educational effect. A company is allowed to apply twice in a year to increase flexibility in regard to the budget for R&D spending, and can submit projects even if it is unsure of whether it will take them up.
Before 2000 virtually all scientific R&D was able to be expensed, and there was a R&D allowance for all firms, allowing plant machinery and buildings to be immediately written off against profits. However, capital expenditure is usually about 10% of R&D, so it was not considered to be that significant. Wages, salaries and current expenditure have no special tax treatment.
In the 2000 UK Budget the Government introduced special tax relief (R&D tax credits) for SMEs. The legislation is in Sch 20 of the Finance Act 2000 (UK). After consultation, similar relief was introduced for large companies (those which are not SMEs) in the 2002 UK Budget. The legislation is in Sch 12 of the Finance Act 2002 (UK).
With the new developments, a SME can claim an extra 50% and large businesses 25%, but if the entity makes a loss this can be surrendered for cash. The company can surrender its qualifying R&D losses to the Exchequer in exchange for a cash payment worth 24% of the spending on R&D. The R&D expenditure must be at least £25,000 a year and the project cannot have received any other government funding, such as Smart or Link funding. The R&D can be carried out either in the UK or overseas. An additional restriction is that a claim for the payable R&D tax credit for SMEs cannot exceed the PAYE/National Insurance liabilities of the company for that accounting period. There is an additional 50% reduction for research on medicine for “killer diseases”. This has been approved by the European Commission as State aid and applies to spending from 22 April 2003, for a period of ten years, as specified by Treasury Order.
For SMEs the R&D tax credit is targeted on the firm that takes the risk and commissions the work. Any capital spending only qualifies for the 100% deduction. Relief is not due unless a company spends more than £25,000 on qualifying R&D expenditure in a 12 month accounting period. Non qualifying expenditure such as the purchase of capital assets is ignored when calculating whether the £25,000 limit has been reached.
For large companies the tax credit is targeted on those who actually undertake the R&D. Any capital spending only qualifies for the 100% deduction. Relief is only incurred after £25,000 has been spent on qualifying R&D in a 12 month accounting period. Provision is made for expenditure on direct R&D, expenditure on R&D sub-contracted to certain organisations that cannot claim the credit in their own right and contributions to certain independent R&D organisations.
A new definition of R&D for tax purposes was introduced by
s 68 and Sch 19 of the Finance Act 2000 (UK), with effect from 1 April 2000. An activity will qualify as R&D for tax purposes if it would be treated as R&D under normal accounting practice for companies in the UK (Statement of Standard Accountancy Practice 13, SSAP13), as qualified by the Guidelines on the Meaning of Research and Development for Tax Purposes (“Guidelines”), issued by the Secretary of State for Trade and Industry. This is based on the OECD’s Frascati Manual definition. The Guidelines have statutory force and discuss in detail the meaning of R&D, and illustrate through explanation and examples the boundary between those activities that are, and are not R&D.
Relief is given on qualifying staff, consumable stores and payments to subcontractors for R&D (SMEs only). The Inland Revenue is in charge of R&D policy, with specialists in different R&D areas, but they do not determine the justification for undertaking R&D projects, although the eligibility for funding of R&D projects is within Inland Revenue’s ambit. It is believed that this is not the Government’s task; even if scientists were employed to undertake the task, the Government is not in a position to understand the commercial objectives of projects and the specialist areas of technology for R&D. Research indicates that taxpayers value the neutrality of the tax credit when compared to a subsidy.
Inland Revenue staff stated that the volume system was introduced rather than the incremental system because it was simpler. When undertaking consultation it was found that the incremental system did not provide enough certainty in the amount of the final credit. Incremental systems are especially complex in the terms of calculating this for groups, which would require extra legislation.
The United States first introduced major tax incentives for R&D in 1981 via the Economic Recovery Act 1981. However, these incentives were tightened in 1986 with the Tax Reform Act 1986 (US) the result being that less expenditure could be classified as R&D.[9]
The expenditures of R&D are generally considered to be capital expenses. However, an entity can choose to deduct these expenditures as current business expenses. An entity may use one of the two following methods of accounting for R&D expenditures: deduct its R&D expenditures in the tax year, in which it was paid or incurred, or amortise such expenditures over a period of not less than 60 months.
An entity must charge to a capital account any R&D expenditures that it does not deduct currently, nor defer and amortise. The entity may claim the R&D credit against tax for certain qualified R&D expenditures, and combine the credit as one of the components of the general business credit. The R&D credit is a non-refundable tax credit. A qualified research expense only is incurred in carrying out the taxpayer’s trade or business. Furthermore, in order to claim a deduction the entity needs to retain substantial rights to the research.
The R&D credit for increasing research activities provides a credit against tax, which is intended to serve as an incentive to conduct certain types of product development research activities and certain basic research (s 41 of the Internal Revenue Code (“IRC”)). The credit has been extended through to 30 June 2004. The credit is an incremental credit equal to the sum of: 20% of the excess of the qualified research expenditures for the taxable year over a base amount, and 20% of the basic research payments.
Qualified research expenses include in-house expenses for wages paid and supplies used in the conduct of qualified research, and 65% (75% in certain instances) of any contract expenses for qualified research. However, an alternate three-tiered research tax credit is available to generate higher research credits for companies with dramatically increasing sales figures or otherwise stagnant research expenditures.
Before taking the credit it is important to determine that the entity is performing qualified research and claiming expenses only for qualified research.
The IRC in s 41 provides a tax credit of 20% of certain increases in qualified research expenses (see IRS Form 6765). The IRC in
s 174 provides that the R&D deduction is reduced by the R&D credit taken under s 280C(c) of the IRC. Alternatively, the taxpayer may elect to take the full R&D deduction but reduce the credit by 35% (the maximum corporate tax rate).
With respect to the financial reporting of R&D expenditure in the US, SFAS 2 (Accounting for Research and Development Costs) requires that R&D generally be expensed as incurred and that each year’s total R&D be disclosed in the financial statements. Overall the items that satisfy the definition of R&D for financial accounting purposes is narrower than for tax purposes and much less flexible.[10] Oliver refers to a study indicating that more than 50% of publicly held US companies reported at least some R&D in the last five years, with R&D accounting for nearly 3% of non-financial corporate GDP in the 1990s.
The article will now focus on the impact of tax breaks on the level of R&D expenditure, along with some analysis of the effectiveness of changes in R&D expenditure on output from international experience, using summaries of overseas studies.
In relation to economic studies examining the impact of tax breaks on R&D, the evidence has been clear in terms of direction although variable in terms of the magnitude of impact. A number of important studies are now briefly discussed in chronological order of their publication.[11]
Bernstein[12] concludes that if there is no growth in the Canadian economy the R&D credits and allowances generate $0.80 additional R&D expenditure per $1 tax foregone. When the effect of the tax credit is in included in the return by virtue of expanded output, the R&D generated exceeds the tax foregone. It was also found that indirect tax incentives aimed at increasing physical investment also increase R&D expenditures. The period studied was 1975-1984, in which current and capital R&D was deductible, a credit received for all current and capital R&D (ranging from 10-25%), and an allowance given for incremental increases.
Cordes’[13] period of study is 1981-1985 in the United States. The study concludes that if the tax credit was made permanent, there would be $0.35-$0.93 additional company R&D spending per $1 tax foregone. Furthermore, the author was of the view that it is possible that the incentives aided growth of R&D in times of recession.
Berger’s[14] study analyses the United States’ tax credit during the 1980s, and the evidence support the credit as having a positive influence, controlling for non-tax factors at the firms level only. The study estimates $1.74 extra spending on R&D for every $1 tax foregone, which is considerably higher than many of the other estimates. The study also discusses the implicit tax cost for those not eligible for credit, has same results as most other studies, with often a negative result for those not receiving the credit.
McCutcheon[15] examines the pharmaceutical industry in relation to the United States’ Tax Reform Act 1986 (US). He concludes that the tax credit caused an increase in R&D expenditures, increased competitive R&D spending in firms in the industry. It is contended that a 1.6% R&D increase is attributable to the credit.
Dagenais et al[16] conclude that a one percent increase in the Canadian Federal tax credit for R&D yields an average of $0.98 additional R&D expenditure per $1 of tax revenues foregone. By way of a contrast, the Department of Finance Canada and Revenue Canada’s[17] study concludes, amongst other observations, that the cost efficiency was found to be $1.38 for every $1 tax foregone.
Bloom et al’s[18] econometric analysis of data on tax changes and R&D spending involves Australia, Canada, France, Germany, Italy, Japan, Spain, United Kingdom and United States. It is estimated that a 10% fall in the cost of R&D (such as through tax breaks and/or credits) stimulates just over a 1% rise in the level of R&D in the short-run, and just under a 10% rise in R&D in the long-run.
Guellec and Van Pottelsberghe,[19] in their working paper, conclude that direct government funding results in $1.70 of research on average for every $1 financed and that tax incentives have a positive, but short-lived effect. They also conclude that: incentives are better if they remain stable over time; that direct government funding and incentives are substitutes in regard to effectiveness; and that the stimulating effect of government funding increases with generosity up to a certain level (about 13%). Too much or too less funding is not as effective as being in the middle range.
Hall and Van Reenen[20] describe the effect of the tax system in OECD countries on the user cost of R&D, and conclude (with many disclaimers) that $1 of tax credit for R&D stimulates an extra $1 of R&D. Lach[21] evaluates the effect of R&D incentives through ascertaining what would have been spent on R&D without the incentives. The evidence from manufacturing firms in Israel suggests that incentives do have a long-run effect. The study also concludes that $1 of subsidies increases long-run company financed expenditures by $0.41 (that is, total R&D expenditures increase by $1.41).
Mulkay and Mairesse[22] analyse the system in France, which has an incremental credit of 50%, with a maximum limit, expiring in 2003. The credit has been in place since 1983, therefore a study was conducted in regard to its effectiveness. During this time there were changes to the statutory rate and the floor and the ceiling, the effects of which can also be evaluated. It was shown that if the rate of the current tax credit is raised by 10% the optimal stock of R&D capital will increase by 4.6% to 6%. The long run increase in R&D expenditure is 3 to 4 times larger than the budgetary cost for the government, an increase of 1.8 to 2.3 billion francs of private R&D expenditure comes with a budgetary cost of 570 million francs.
Commentary will now be provided on the public/private interaction and effectiveness of R&D partnerships. This analysis includes a review of tax breaks encouraging links between private sector and public sector organisations with the private sector obtaining the tax break but the public sector organisation (including universities) the increase in research expenditure. In relation to the interaction between public and private sector R&D funding, there have been several studies conducted, and these are now briefly discussed.
Lattimore’s[23] overall conclusion is that the objective of R&D fiscal measures is to induce substantial and worthwhile R&D at low cost to taxpayers. The R&D tax concession applies to all R&D, rather than to only the additional R&D. As a consequence there is substantial dissipation of the concession as transfer payments to firms. These generate real economic costs as some of these transfers flow to foreigners, and the revenues lost from such concessions must be financed through additional distortionary taxation. This means that there must be high spillovers to other areas from the modest amount of induced R&D to generate net benefits.
Lattimore is relatively confident that the Australian tax concession does generate net social benefits – especially at its lower current rate of 125%. A number of possible modifications and elaborations of innovation policy could be further explored, suggests Lattimore, particularly aimed at increasing inducement. Lattimore notes that none of his modifications may be feasible, but they should be considered further.
David and Hall[24] attempt to explain inconsistencies in the empirical literature regarding the response of company financed R&D to changes in the level and nature of public R&D expenditure. They conclude that increasing the share of public R&D research devoted to basic research increases the private share of R&D.
Guellec and Van Pottelsberghe[25] investigate the long-term effects of various types of R&D on multifactor productivity growth, which represents the spillover effect of R&D. Econometric estimates were used on a panel of 16 OECD countries. The authors conclude that: an increase of 1% in business R&D generates 0.13% in productivity growth; and that the effect is larger in countries which are intensive in business R&D and in countries where the share of defence-related government funding is lower. They also conclude that a 1% increase in foreign R&D provides a 0.44% productivity growth; and a 1% increase in public R&D provides a 0.17% productivity growth. Furthermore, the effect is larger where there is more university R&D as opposed to government laboratories.
Van Pottelsberghe et al,[26] amongst the plethora of findings from their recent study, conclude that some countries also have incentives for the collaboration between industry and qualified research organisations. The United States provides a special tax credit for payments to qualified organisations to conduct research, and increases the amount of research expense eligible for the credit to 75% if subcontracted to a qualified organisation. In Australia only contracted work with a registered research agency is eligible for the tax incentive, but also the cost of acquiring patent eligible. Denmark looks to promote public and private co-operation in R&D by having a 150% deduction of investments co-financed by a public university or research institute and the industry. This is a new development currently in a test period scheduled to run for two years.
The authors also recommend for the European Union volume-based tax incentives over incremental tax incentives to stimulate R&D, that the system have assured refundability, and have visible incentives so as to influence business decisions, such as in Canada. They also suggest that personal income tax breaks may be used to attract researchers from abroad but this is an area for future research.
The importance of relationship building between government and those undertaking R&D was the key to Israel’s success in terms of technological growth, according to Steinman.[27] Provision of funding to create the next generation of technological innovation and assistance for companies and other researchers to move their products overseas are also vital ingredients.
In relation to the preference for the various types of R&D incentives that may be provided, a number of key studies are summarised below, in chronological order.
Swenson[28] observes that since there have been numerous differing conclusions regarding the effect of the United States tax credit in the 1980s, his study attempts to control for other non-tax factors that would reduce these anomalies. The study concludes that the R&D tax credit is effective in stimulating R&D expenditures for high growth firms and only for some normal growth firms. There were difficulties involved because the credit was frequently extended on a year by year basis, causing distortion in analysis as firms accelerate R&D in the year the credit is due to expire.
The Department of Finance Canada and Revenue Canada’s[29] 1996 study involved surveying firms that have claimed deductions or credits for SR&ED, with a companion survey of accounting firms and consultants that specialise in assisting these claims. The study concludes that: the incentive has a large impact on SR&ED activity, through higher expenditures on R&D, and that the effect was also incremental. The incentive was found to be cost-effective and competitive advantage was an important reason for conducting R&D. The research found that most work is in applied research and experimental development, that more spending on new products rather than on new processes is needed; and IT and manufacturing accounted for most of the claimants. The study also identified that R&D is an important part of a firm’s strategy. Importantly the tax credit is the most influential of all forms of government support. Finally, there did not seem to be a problem with imitation.
Gunz et al[30] attempted to measure the compliance cost of R&D tax incentives. Although there is extensive technical and financial record keeping, the compliance costs of the R&D tax credit are only 0.7% of the credits claimed (however, firms with claims of $200 or less face 15% costs). Firms with small claims have high costs, regardless of the size of the firm. These costs are incurred mainly by scientific and technical staff, rather than accounting staff. Overall, the tax credit was preferred to government grants in terms of compliance costs.
Kauko’s[31] study shows that grants have weak effects in interview studies, which is inconsistent with econometric studies. The problem is that grants are not randomly chosen, but sometimes treated like they are. The study concludes that public subsidies are a more inefficient stimulus than the research portrays.
The Department of Finance Canada and Revenue Canada,[32] in a subsequent study in 1998, used various methods to assess the Canadian R&D credit, including interviews, focus groups, income tax information, and two surveys. The Federal SR&ED tax credit was rated as the most important component in the system of government support followed by refundability of the federal credit, while government grants and contracts received the lowest rating. More than half of the firms reported employment growth for the period 1992 to 1994, with medium-sized firms in the area of information technology SR&ED most likely to report employment increases. Furthermore, current and capital expenditures eligible for the federal SR&ED tax incentives (that is, allowable expenditures) increased in the case of: all corporations, by 50% from C$4.5 billion in 1988 to C$6.9 billion in 1992; and smaller corporations, by 100% from C$0.7 billion in 1988 to C$1.4 billion in 1992.
Lach[33] observes that Israel has experienced a boom in the technology area. In Israel there is a subsidy program whereby firms commit to matching dollar for dollar the subsidy given by the Office of the Chief Scientist. If the project is commercially successful the firm pays back the subsidy in the form of royalties.
The European Commission’s[34] comprehensive and recent study sought to offer suggestions and guidelines on the design and implementation of fiscal measures to stimulate private investment in R&D. It concluded that fiscal incentives stimulate business R&D and that the design of these fiscal incentives is crucial to the effectiveness of these schemes. Existing evaluations of fiscal R&D incentive schemes in different countries cannot be compared in the European Union due to the use of different methodologies, incommensurable data sets and dissimilar time periods. More research is therefore needed on the micro level and at the higher macro level.
Other conclusions made in this study include a recommendation that volume-based schemes (rather than incremental schemes) for determining R&D tax credits are easier to administer for both firms and public authorities. They are arguably better for raising overall R&D expenditure levels. The principles for good policy design require: simplicity, low administration costs, low compliance costs, reliability and long-term stability; assured refundability; good visibility and transparency; and use of the OECD’s Frascati definition for R&D.
This Section reviews the previous discussion through setting out key findings and provides a summary of the main conclusions and recommendations relating to improving the New Zealand situation regarding tax incentives for R&D expenditure.
The OECD’s[35] 2002 study summarises the major findings of the economic analysis studies on the effectiveness of R&D tax credits, where the negative sign of the estimated elasticity of the R&D tax credit indicates greater levels of R&D expenditure through provision of the tax credit (which serves to reduce the cost of carrying out the R&D). It is acknowledged that a potential limitation of this analysis is that the vast majority of the studies are from Canada and the United States. Table 1 reproduces Table 5 from this OECD report:
|
Study
|
Estimated Elasticity of R&D to Tax Credit
|
Period of Analysis
|
Country
|
|
Australian Bureau of Industry Economics (1993)
|
-1.0
|
1984-94
|
Australia
|
|
McFelridge and Wards (1983)
|
-0.6
|
1962-82
|
Canada
|
|
Mansfield and Switzer (1985)
|
-0.04 to -0.18
|
1980-83
|
Canada
|
|
Bernstein (1986)
|
-0.13
|
1981-88
|
Canada
|
|
Bernstein (1996)
|
-0.14 (short run) -0.3 (long run)
|
1964-92
|
Canada
|
|
Mansfield (1986)
|
-0.35
|
1981-83
|
United States
|
|
Berger (1983)
|
-1.0 to -1.5
|
1981-88
|
United States
|
|
Bally and Lawrence (1987, 1992)
|
-0.75
|
1981-89
|
United States
|
|
Hall (1993)
|
-1.0 to -1.5
|
1981-91
|
United States
|
|
McCutchen (1993)
|
-0.28 to -1.07
|
1982-85
|
United States
|
|
Hines (1993)
|
-0.28 to -1.07
|
1984-89
|
United States
|
|
Nadri and Mamuneaus (1996)
|
-0.95 to -1.0
|
1966-88
|
United States
|
|
Bloom, Griffith and Van Reemen (1999)
|
-0.16 (short run) -1.1 (long run)
|
1979-94
|
G7 and Australia
|
In the OECD’s[36] 1996 report, it is observed that tax incentives as a means of stimulating R&D spending offer several advantages compared to subsidies or grants assistance programmes. Specifically tax incentives entail less interference in the marketplace, and thus allow private-sector decision makers to retain autonomy, require less paperwork and entail fewer layers of bureaucracy and avoid the need to set nebulous and detailed requirements for receiving assistance. The study also concluded that tax incentives have the psychological advantage of achieving a favourable industry reaction and have a high degree of political feasibility.
However, criticisms of tax incentives are made in relation to the advantages noted above, including the following disadvantages of tax incentives compared to other assistance programmes. Tax incentives bring about unintended windfalls by rewarding what would have been done without the tax incentive, and they lead to undesirable inequities. Furthermore, tax incentives can raid the national treasury and are an ineffective means to achieve focused results.
Van Pottelsberghe et al[37] provide an excellent summary of the advantages of fiscal incentives over direct financial support (R&D grants), which is reproduced below as Table 2 (reproducing Table 1 from their study).
|
Direct Financial Support
|
Fiscal Incentives
|
|
More targeted
|
More neutral
|
|
- Social return >>> Private return
|
- Business knows better
- Avoid picking winners
- Market friendly
|
|
|
|
|
Better budget control
|
More predictable for companies
|
|
|
Wider reach
|
|
|
Administrative cost can be very low
|
|
|
More accessible
|
In a report prepared for the European Commission,[38] a summary of the use of R&D tax credits and allowances by a number of countries is provided, and this is appears below as Table 3 (reproducing Table 2 from this report).
|
|
Volume base
|
Incremental
|
Combination of Volume based and Incremental
|
|
R&D tax credits
|
Canada
Italy
Korea
Netherlands
|
France
Japan
Korea
Mexico
United States
|
Portugal
Spain
|
|
R&D allowances
|
Denmark
United Kingdom
|
Norway
Belgium
|
Australia
Austria
Hungary
|
In its report, the European Commission concludes that, in the absence of extensive evaluation studies, and taking into account the methodological difficulties attached to many of the econometric studies, one can say with some caution that fiscal incentives stimulate business R&D. However, it is difficult to evaluate the amount of additional R&D per unit of forgone public revenue. The few tentative evaluations show a positive, but moderate, level of additionality. Nevertheless, the substantial amount of potential externalities (R&D spillovers) would strengthen the positive impact of any tax credit. Furthermore, methodological difficulties in establishing the effect of fiscal incentives present a large unknown factor. There is a clear need for more formal evaluations that would use several alternative methods. So far, there is a preponderance of evaluations for the Canadian and American tax incentives.
The report also suggests that there is a need for better micro-level data sets to understand the long-term impact of fiscal incentives on business R&D, and that no evaluation has so far attempted to evaluate the impact of alternative designs of tax incentives. The existing evaluations for different countries cannot be compared due to the use of different types of data, methodologies, scope and time periods. The key point is that the specific design of a fiscal incentive seems to be the key factor underlying its effectiveness.
There is little, if any, consistency in R&D fiscal policy internationally, which is also illustrated by Van Pottelsberghe et al[40] in a table comparing R&D fiscal policies in European Union nations and selected OECD nations. Hall and van Reenen[41] also provide in the appendices to their working paper a summary of R&D systems around the world, illustrating their diversity in nature.
The OECD’s[42] 1996 report presents the findings of a comprehensive study on fiscal incentives and R&D, concluding that with regard to best practices in designing and implementing R&D tax provisions, a number of key factors existed. R&D tax policy should be designed as part of an overall strategy to stimulate innovation in industry and should complement other science and technology policies. The R&D tax policy may be designed to further specific national goals, such as fostering basic research or the purchase of high-technology equipment. R&D tax policy should also generally include provisions for the deduction of all qualified R&D expenses in the year in which they are incurred, which has been shown to increase the additional research undertaken by firms.
R&D tax policy should be flexible in order to accommodate firms at different stages of development. For example, the ability to carry deductions forward allows firms without tax liabilities in a given year to take advantage of R&D tax incentives. The value of R&D tax credits must be assessed on a country by country basis. The design of these schemes differs broadly by country depending on whether they are volume-based or incremental, based on R&D expenditures or wage costs and vary their treatment of firm size, region or technology. Their benefits depend on overall tax systems including the corporate tax rate and the time-lag associated with firm responses. R&D tax policy should consider including special provisions relating to small and/or new firms in order to encourage entrepreneurship and innovative start-ups.
New Zealand was reported in the OECD’s[43] 1996 report as the OECD member providing the least R&D tax support, although this has improved in recent times, assisted by the adoption of FRS 13 into the ITA 1994 for the tax treatment of R&D expenditure. Nevertheless, New Zealand remains near the bottom of the list. This suggests that there is scope for further initiatives to improve New Zealand’s investment in R&D.
In a more recent OECD study in 2002,[44] the OECD observed that given the contribution of R&D to productivity growth, economic performance and the achievement of social objectives, it is generally agreed that governments have a role in encouraging appropriate R&D levels and expenditures. With regard to business R&D, national factors largely determine whether countries prefer tax incentives, subsidies, patent rights or other instruments to increase research investments. The choice of R&D tax incentives will depend on country-level variables such as overall innovation performance, perceived market failures in R&D, industrial structure, size of firms and the nature of corporate tax systems.
Some OECD countries (for example, Sweden and Finland) neither subsidise nor extend preferential tax treatment to business R&D although these countries have high levels of private R&D expenditures.
Other countries (for example, New Zealand) prefer R&D subsidies (or grants) over tax credits and incentives to steer research to particular goals and avoid jeopardising the neutrality of the tax system. This most recent approach of providing grants places the New Zealand Government and officials in the role of “picking winners”, which introduces the risk that factors other than the potential future value and contribution of the R&D, such as political bias, will be major factors in the decision-making process. Encouraging particular fields for R&D, rather than seeking applications for grants for all projects which are evaluated against specified criteria, is less desirable and in all probability is objectionable as the choice of fields or industries may be politically motivated and/or selected without regard to the potential value and contribution of the R&D for all projects. R&D grants will always have a factor of choice that is made by the government and officials, rather than through firms determining which R&D projects to pursue, with the tax system providing some incentives (albeit with a risk that some firms may only pursue an activity due to the particular tax incentives available).
Countries such as France, the United States and the United Kingdom use a combination of subsidies and tax incentives to stimulate private R&D investments. The OECD’s 2002 report provides an excellent discussion on the role of fiscal incentives for R&D, the issues involved in the design of such incentives, a comparison of OECD members’ generosity of fiscal incentives and the various costs and benefits.
Van Pottelsberghe et al[45] recommended that for the European Union (and possibly further a field) fiscal incentives for R&D should reflect these principles: a design with simplicity, low administrative and compliance costs, reliability and long-term stability; a concrete checklist for assessment; a volume based rather than incremental systems; refundability of tax credits (with carryforward/carrybackwards arrangements); visibility and transparency; a clear definition of R&D; formal evaluation processes; the creation of relevant databases; an optimal tax policy mix for business R&D; and effective coordination between government and business.
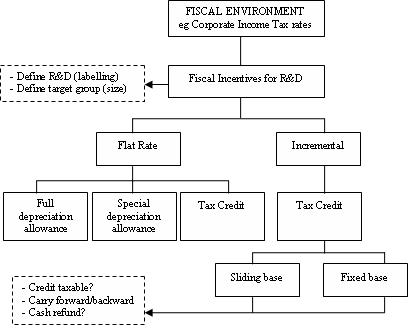
Van Pottelsberghe et al[46] provide a diagrammatical format for the decisions involved in designing fiscal policies for R&D, which could be considered for application in New Zealand, and this is set out as Figure 1 (reproducing Figure 2 from this study):
FISCAL ENVIRONMENT
eg Corporate Income Tax rates
Fiscal Incentives for R&D
- Define R&D (labelling)
- Define target group (size)
Flat Rate
Incremental
Full depreciation allowance
Special depreciation allowance
Tax Credit
Tax Credit
Sliding base
Fixed base
- Credit taxable?
- Carry forward/backward
- Cash refund?
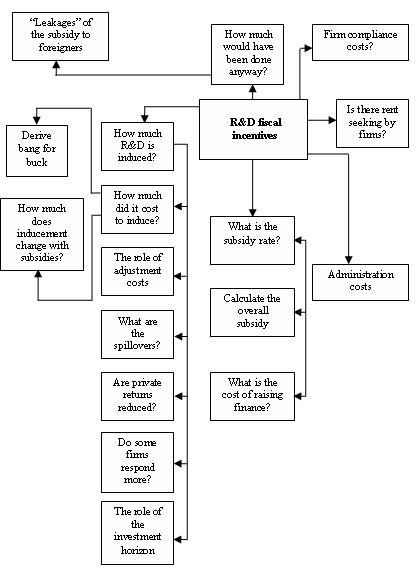
In an earlier study, Lattimore,[47] as part of the OECD’s 1997 study,[48] provides a framework for evaluating R&D concessions. Lattimore[49] later provides a series of design principles or issues for developing tax policy for R&D, including targeting the source of the problem, a cost and benefit analysis, and evaluation. The following diagram, Figure 2, is taken from this study and should be given serious consideration for New Zealand:
“Leakages” of the subsidy to foreigners
How much would have been done anyway?
Firm compliance costs?
R&D fiscal incentives
Is there rent seeking by firms?
How much R&D is induced?
How much did it cost to induce?
The role of adjustment costs
What are the spillovers?
Are private returns reduced?
Do some firms respond more?
The role of the investment horizon
How much does inducement change with subsidies?
What is the subsidy rate?
What is the cost of raising finance?
Calculate the overall subsidy
Administration costs
Derive bang for buck
By way of a final series of observations, in the Department of Finance and Revenue Canada[50] study of the G7 nations plus Australia,[51] the conclusion is reached that there is theoretical and empirical evidence that R&D is subject to market failure. In response to this market failure, most countries provide assistance for R&D in the form of tax or non-tax incentives. The specific form of government support used depends on the nature of the market failure and the policy objectives being pursued. Tax and non-tax incentives possess different characteristics and may be used to achieve alternative but complementary objectives. In terms of their effectiveness, existing evidence seems to favour the use of tax incentives over direct subsidies such as grants. New Zealand, however, appears to be ignoring this evidence, preferring incentives to be in the form of government targeted subsidies (grants) while tax incentives are minimal (see Section 2 above).
Furthermore, the Department of Finance and Revenue Canada’s 1998 report argues that many countries use income tax incentives to encourage R&D. In general, the incentives focus on R&D undertaken within national boundaries for business purposes. Definitions of R&D for tax purposes differ, sometimes significantly, from the OECD benchmark in order to meet the policy objectives of particular countries. Some R&D tax incentives are structured to deliver broadly based support, others target specific types of R&D or companies (eg, new firms, smaller firms or non-taxpaying firms), and still others focus on regional objectives. There are also significant international differences in the design and mix of the R&D tax incentives currently being employed to foster this type of investment. Countries offer various types of accelerated deductions, bonus deductions or investment tax credits based on either total or incremental spending.
To conclude, in Section 2, six OECD member nations’ taxation regimes for R&D were summarised as aspects of each regime were considered worthwhile for further examination by New Zealand policymakers, namely the regimes in Australia, Canada, Japan, Netherlands, United Kingdom and United States. Investigation is considered to be warranted for consideration of both R&D allowances/tax credits, such as accelerated depreciation and deductions in excess of one hundred percent of qualifying expenditure,[52] and for R&D credits, including refundability and carryforwards. Targeting of SMEs is also worthy of consideration, given New Zealand’s preponderance of such entities.
Section 3’s analysis of the effectiveness of tax credits for stimulating R&D indicates clearly that additional tax credits will normally produce additional R&D expenditure and will generally be cost effective. In terms of the preference between tax credits and government subsidies through grants, the research clearly demonstrates that the tax credit is preferred (by businesses) and is the most influential of all forms of government support. For instance, in Canada, the Federal SR&ED tax credit was rated as the most important component in the system of government support followed by refundability of the federal credit, while government grants and contracts received the lowest rating. The tax credit is also preferable in terms of incurring the lowest level of compliance costs. Notwithstanding this evidence, the New Zealand Government and officials prefer a grants scheme, the opposite of what the research indicates is preferred by businesses. Some minor progress has been made on improving the current meagre tax incentives for R&D (such as the definition of R&D and incorporating approaches from financial reporting standards).
A limitation of the analysis provided in this article is that it presents a substantial range of observations and recommendations from international studies on R&D in summary form, rather than an in-depth analysis of the various approaches advocated in the studies. This article is intentionally exploratory in nature rather than setting out to provide an in-depth discussion of detailed recommendations for R&D expenditure tax credits and concessions in New Zealand. Such an analysis should be the subject of future research once critical policy decisions are made to explore particular options.
The literature on R&D tax incentives is both substantial and diverse. This article draws together significant aspects of this literature, primarily for consideration by policymakers in a country that is firmly placed in the bottom third of the OECD in terms of R&D as a percentage of GDP, yet which purports to encourage significant investment in R&D. Tax incentives internationally form a major component of the process for encouraging R&D. New Zealand is at the cross roads in terms of assessing which path to follow to encourage greater investment in R&D. The New Zealand Government currently prefers grants (subsidies) over tax incentives, notwithstanding the findings in the literature. Minor, yet important improvements have been made to the tax treatment of R&D expenditure. The evidence provided in this article provides guidance for a possible future direction and should be an impetus for action, including a revisiting of the current tax and grants approach to R&D expenditure in New Zealand.
[∗] Department of Accountancy, Finance and Information Systems, University of Canterbury, New Zealand. I would like to thank the Royal Society of New Zealand that both commissioned a report and provided a research grant to enable the underlying research that supports this article to be completed and an anonymous referee that provided helpful comments to improve this article. Further details may be obtained from this report, completed in February 2004, which is available via the Royal Society of New Zealand’s website at: http://www.rsnz.org/. The author also wishes to express his gratitude to his research assistant for her valuable contribution in searching the literature, reading and synthesising the information, and providing him with useful summaries of many of the studies. The research issues discussed in this article reflect those commissioned by the Royal Society of New Zealand.
[1] It is assumed in this article that more investment in R&D is normally considered to be a positive development and is thus preferred over less investment in R&D. Underlying this assumption are economic arguments concerning the justification for intervention by government through encouraging R&D in specific areas, or to correct for the market’s inability to adequately stimulate R&D activity. Discussion of these issues is beyond the scope of this article.
[2] Further comment on specific country regimes is made in section one of the report to the Royal Society of New Zealand.
[3] For an in-depth examination of the changes in New Zealand’s tax treatment of R&D, see B Lemmens, “Aligning Research and Development Expenditure Tax Treatment with Accounting Treatment: Comparing New Zealand and International Approaches” (2002) 8 New Zealand Journal of Taxation Law and Policy 33.
[4] In the original Royal Society of New Zealand report a brief summary was provided for each of the 30 members of the OECD (plus Singapore), where information is available on the tax treatment of R&D expenditure.
[5] For an earlier summary of tax incentives for R&D in Canada, Japan, the United Kingdom and the United States, plus France and Germany, see RD Griffith, D Sandler and J van Reenan, “Tax Incentives for R & D” (1995) 16 Fiscal Studies 21.
[6] New Zealand has recently introduced similar rules for expenditures of all types, not R&D expenditure specifically.
[7] Department of Finance Canada and Revenue Canada, Evaluation Report: The Federal System of Income Tax Incentives for Scientific Research and Experimental Development (1998) (“Evaluation Report”); available at:
http://www.fin.gc.ca/resdev/fedsys_e.html.
[8] For discussion on the previous regime in Japan, see Griffith et al, above n 5, 40.
[9] For further discussion see Griffith et al, above n 5, 40-41.
[10] See JR Oliver, “Accounting and Tax Treatment of R&D: An Update” (2003) 73(7) The CPA Journal 46.
[11] The more recent studies provide an update to Griffith et al, above n 5.
[12] JI Bernstein, “The Effect of Direct and Indirect Tax Incentives on Canadian Industrial R&D Expenditures” (1986) 12(3) Canadian Public Policy 438.
[13] JJ Cordes, “Tax Incentives and R&D Spending: A Review of the Evidence” (1989) 18 Research Policy 119.
[14] PG Berger, “Explicit and Implicit Tax Effects of the R&D Tax Credit” (1993) 31 Journal of Accounting Research 1312.
[15] WW McCutchen, “Estimating the Impact of the R&D Tax Credit on Strategic Groups in the Pharmaceutical Industry” (1993) 22(4) Research Policy 337.
[16] M Dagenais, P Mohnen and P Therrien, Do Canadian Firms Respond to Fiscal Incentives to Research and Development? (Centre Interuniversiare de Researche en Analyse des Organisations, Serie Scientifique; 1997); available at:
http://www.cirano.qc.ca/pdf/publication/97s-34.pdf.
[17] Evaluation Report, above n 7.
[18] N Bloom, R Griffith and J Van Reenen, Do R&D Tax Credits Work?: Evidence from a Panel of Countries 1979-97 (Working Paper 99/8; Institute for Fiscal Studies and University College, London; 2000); available at:
http://www.ifs.org.uk/innovation/jpubefinal_ifs.pdf.
[19] D Guellec and B Van Pottelsberghe, The Impact of Public R&D Expenditure on Business R&D (DSTI Working Paper; Organisation for Economic Cooperation and Development; 2000); available at:
http://www.ulb.ac.be/cours/solvay/vanpottelsberghe/resources/Pap_EINT_2.pdf.
[20] B Hall and J Van Reenen, “How Effective Are Fiscal Incentives for R&D? A Review of the Evidence” (2000) 29 Research Policy 449; available at: http://www.nber.org/papers/w7098.pdf.
[21] S Lach, Do R&D Subsidies Stimulate or Displace Private R&D? Evidence From Israel (Working Paper No 7943; National Bureau of Economic Research; 2000); available at: http://www.nber.org.
[22] B Mulkay and J Mairesse, The Effect of the R&D Tax Credit in France (2003); available at:
http://www.eea-esem.com/eea-esem/2003/prog/viewpaper.asp?pid=2250.
[23] R Lattimore, Research and Development Fiscal Incentives in Australia: Impacts and Policy Lessons, in OECD, Policy Evaluation in Innovation and Technology: Towards Best Practices (1997).
[24] PA David and BH Hall, Heart of Darkness: Public-Private Interactions Inside the R&D Black Box (Economic Discussion Paper no 1999-W16; Nuffield College, Oxford; June 1999); available at: www.nber.org/paper/w7538.pdf.
[25] D Guellec and B Van Pottelsberghe, R&D Productivity Growth: Panel Data Analysis of 16 OECD Countries (DSTI Working Paper 2001/3; Organisation for Economic Cooperation and Development; 2001), available at:
http://www.ulb.ac.be/cours/solvay/vanpottelsberghe/resources/DGBVP_OES.pdf.
[26] B Van Pottelsberghe, S Nysten and E Megally, Evaluation of Current Fiscal Incentives for Business R & D in Belgium (Working Paper; Solvay Business School; Universite Libre de Bruxelles; 2003); available at:
http://www.belspo.be/belspo/stat/rap/fiscRDJune03.pdf.
[27] J Steinman, “Israel shows way to Technology-led Growth” (2004) The National Business Review (May 21) 39.
[28] CW Swenson, “Some Tests of the Incentive Effects of the Research and Experimentation Tax Credit” (1992) 49 Journal of Public Economics 203.
[29] Department of Finance Canada and Revenue Canada, Survey of Scientific Research and Experimental Development Claimants (Project Report prepared by ABT Associates of Canada for Revenue Canada; 1996); available at: http://www.fin.gc.ca/toce/1998/resdev_e.html.
[30] S Gunz, A Macnaughton and K Wensley, Measuring the Compliance Cost of Tax Expenditures: The Case of Research and Development Incentives (Working Paper No 6; Industry Canada; 1996). A revised version of the paper was published; see
S Gunz, A Macnaughton and K Wensley, “Measuring the Compliance Cost of Tax Expenditures: The Case of Research and Development Incentives” (1995) 43 Canadian Tax Journal 2006. The working paper is available at:
http://strategis.ic.gc.ca/pics/ra/wp6e.pdf.
[31] K Kauko, “Effectiveness of R&D Subsidies – A Sceptical Note on the Empirical Literature” (1996) 25 Research Policy 321.
[32] Evaluation Report, above n 7.
[33] Lach, above n 21.
[34] European Commission, Raising EU R&D Intensity: Improving the Effectiveness of Public Support Mechanisms for Private Sector Research and Development (2003) (“EC Report”); available at:
http://www.europa.eu.int/comm/research/era/3pct/pdf/report-fiscalmeasures.pdf.
[35] OECD, Tax Incentives for Research and Development: Trends and Issues (2002) 25 (“OECD 2002 Report”); available at:
http://www.oecd.org/dataoecd/12/27/2498389.pdf.
[36] OECD, Fiscal Measures to Promote R&D and Innovation (1996) 25-26 (“OECD 1996 Report”); available at: http://www.oecd.org/dataoecd/35/15/2101604.pdf.
[37] Van Pottelsberghe et al, above n 26, 7.
[38] EC Report, above n 34, 5.
[39] Based on J Warda, A 2001-2002 Update of R&D Tax Treatment in OECD Countries (Report Prepared for the OECD Directorate for Science, Technology and Industry; 2002).
[40] Van Pottelsberghe et al, above n 26, 17.
[41] Hall and Van Reenen, above n 20.
[42] OECD 1996 Report, above n 36, 25-26.
[43] Ibid.
[44] OECD 2002 Report, above n 35.
[45] Van Pottelsberghe et al, above n 26, 39-40.
[46] Ibid 19.
[47] Lattimore, above n 23, 99.
[48] OECD, Policy Evaluation in Innovation and Technology: Towards Best Practices, (1997); available at:
http://www.oecd.org/document/23/0,2340,en_2649_34409_1822359_119681_1_1_1,00.html.
[49] Lattimore, above n 23, 119.
[50] Evaluation Report, above n 7.
[51] Canada, France, Germany, Italy, Japan, the United Kingdom and the United States, plus Australia.
[52] Ranging from just over 100% up to 200% in Singapore, with most in the range of 125-150%.
AustLII:
Copyright Policy
|
Disclaimers
|
Privacy Policy
|
Feedback
URL: http://www.austlii.edu.au/au/journals/JlATax/2005/3.html