
Journal of Law and Financial Management

|
|
Home
| Databases
| WorldLII
| Search
| Feedback
Journal of Law and Financial Management |
|
By Alex Frino, Grant Wearin & Joel Fabre*
Previous papers documenting the relationship between returns on stock index futures and stock indices typically ignore dividends1. This appears to leave open the issue of whether the return on a synthetic position constructed using stock index futures and a risk free asset efficiently delivers the value of dividends. This paper proves mathematically that the returns on synthetic positions using such contracts should deliver capital gains, cash dividends and the value of franking credits derived by arbitrageurs. Empirical evidence consistent with this proposition is provided, using a sample of data for the SPI 200 contract trading on the Sydney Futures Exchange. Interestingly, the evidence suggests that franking credits are priced into stock index futures contracts, despite the introduction of the 45-day rule which seemingly would appear to prevent this.
JEL Classification: G11; G12; G13; G28
Keywords: Synthetic portfolios, stock index futures, dividends, franking credits
With the proliferation of managed funds in the last three decades, stock indices continue to play a central role in benchmarking the performance of equity fund managers. This is especially the case for index managers, who face the fundamental challenge of minimizing tracking error - the absolute difference between the fund return and the index return - while controlling transaction costs2. This has contributed to the development of financial instruments such as stock index futures, which enable investors to obtain index exposure synthetically, that is, without physically trading stocks3. Compared to alternatives such as exchange-traded-funds or index options, index futures offer the lowest cost method of investing in stock indices4. However, a common misconception is that use of these contracts necessitates the sacrifice of stock dividends5. We provide a mathematical proof supporting the notion that a synthetic position made up of stock index futures contracts and a risk free asset can synthetically generate the return obtained by investing in each stock in the index portfolio. Prior academic literature documenting the relationship between returns on stock index futures and stock indices, focusing on hedging effectiveness, typically ignores dividends6. All of these studies examine price indices, which omit dividends. This appears to leave open the issue of whether the return on a synthetic position constructed using stock index futures and a risk free asset effectively delivers the value of dividends. This is doubly important in jurisdictions such as Australia where franking credits are attached to dividends, and raises the question of whether synthetic positions also deliver franking credits. These issues are particularly relevant to fund managers, who are typically benchmarked to accumulation indices, which include dividends.
This paper provides new evidence on the relationship between returns on stock index futures and stock indices by examining whether the returns to synthetic positions constructed using stock index futures and a fixed income security deliver capital gains, dividends and franking credits. It is proven mathematically that if franking credits are priced into a stock index futures contract by arbitrageurs, then returns on synthetic positions constructed using a fixed income security and stock index futures deliver capital gains, cash dividends and the value of franking credits derived by arbitrageurs. Empirical evidence consistent with this proposition is also provided, using a sample of data for the SPI 200 contract trading on the Sydney Futures Exchange (SFE). The analysis demonstrates that a synthetic position constructed using the SPI 200 and a Bank Accepted Bill (BAB) outperforms the return on the S&P/ASX 200 Accumulation Index. Furthermore there is a significant positive relationship between outperformance and franking credits paid out by the index. Interestingly, one of the implications of this empirical evidence is that franking credits are priced into stock index futures contracts, despite the introduction of the 45-day rule which seemingly would appear to prevent this.
The remainder of this paper is organized as follows. Section 2 proves mathematically that the returns to synthetic positions using stock index futures and a fixed income security deliver capital gains, dividends and franking credits. Section 3 describes the data used in the empirical analysis. Section 4 provides empirical analysis of the performance and effectiveness of the synthetic position in delivering the value of dividends and franking credits. Section 5 concludes.
A fundamental choice for index managers is whether to replicate index returns directly by purchasing the underlying stocks, or synthetically through the use of instruments such as index futures. To replicate the return on an index, an investor needs to generate the return that would be achieved by holding the stocks in the index portfolio, with the correct weightings. Before taxes and transaction costs, this return comprises capital gains, dividends and any franking credits attached to the dividends. Therefore, delivery of the value of dividends and any attached franking credits contributes to the efficacy of a replication strategy. Because index futures are normally based on price indices, there may be a perception that returns obtained from replication strategies using index futures do not deliver the value of dividends or franking credits. However, when combining index futures with a risk free asset to create a synthetic position the returns will accrue dividends. The proof below demonstrates that the returns to a synthetic position comprising a long position in an index futures contract and a fixed income security, in fact, replicate the return to an accumulation index.
There are several assumptions underlying the proof. First, the proof relies on the linear cost-of-carry model to value the futures contract, which implies an assumption that the futures trade at fair value. Second, it is assumed that the interest rate representing the financing cost in the cost-of-carry model is approximately equal to the rate of return on the bond. To the extent that either of these assumptions do not hold, there will be some tracking error between the returns of the index portfolio and the synthetic position. Third, for each exposition we ignore the re-investment of dividend returns that accrue to the synthetic position7.
Index Portfolio Return
From one point in time T-1 to another T, the return on all stocks comprising the index portfolio when dividends are re-invested is precisely the same as the return on an accumulation index. In notational format:
where:  (1)
(1)
IT is the value of the index portfolio at time T
dt is the dividend paid out by the index portfolio over period t (i.e., from T-1 to T).
Synthetic Position Return
The return on a synthetic position is given by the return on the futures contract plus the return on the bond from T-1 to T. Since the investment in the futures contract is costless, then the cost of the portfolio is simply the value of the index portfolio (IT-1) which represents the amount of cash available for investment in the bond. Denoting the price of the futures contract at time T as fT, then the return on the synthetic position r’p is given by the following expression:
where: 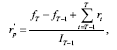 (2)
(2)
![]() is the return on
the bond in dollars from T-1 to T.
is the return on
the bond in dollars from T-1 to T.
Index Portfolio and Synthetic Position Equivalence
To prove that the return on the synthetic position given by (2) is equivalent to the return on the index portfolio including dividends (1) we begin by stating the cost-of-carry model which implies that the futures price fT can be written as follows:
where: ![]() (3)
(3)
dt is the dividend paid (in dollars) by the index portfolio in period t
rt is the opportunity or financing cost of investing in the index portfolio
n is the maturity date of the futures contract.
Using (3) the futures price fT-1 can be written as follows:
. ![]() (4)
(4)
Substituting (3) and (4) into (2) yields:
which can be re-arranged and simplified as follows:

Since (5) is identical to (1), we have proven that the return on the synthetic position is equal to the return on the index portfolio plus dividends. If dt is defined as the value of dividends including franking credits, then trivially from (5), it follows that the synthetic position will return the value of franking credits as well as dividends.
The empirical analysis focuses on a widely used Australian benchmark index, the S&P/ASX 200. Data on the cash index, associated dividends and franking credits, SPI 200 index futures and returns on BABs were gathered for the period September 1, 2001 to September 30, 20038. Closing prices for the accumulation and price indices were downloaded from the S&P website. The index file contains closing index values, which are calculated and disseminated by S&P at 4:05 p.m. on each trading day. S&P calculates closing index values using the closing prices of constituent stocks, determined in the SEATS call auction for each stock at approximately 4:05 p.m.
Transaction data for SPI 200 futures were provided by the SFE. The SFE file describes the prices of trades for the contract nearest to expiry and the next nearest contract, and is time-stamped to the nearest second. The last price transacted before 4:05 p.m. were extracted from the SFE files. Only prices recorded at 4:05 p.m. were used as these are synchronized with ASX closing prices upon which the underlying index is calculated. The 25-minute difference in closing times would result in error in the measurement of tracking error if reported futures closing prices were used9. Data on 90-day BABs were gathered from a file containing a daily time-series of BAB yields, provided by the Reserve Bank of Australia.
A daily time-series of accumulation and price index returns, SPI 200 returns and 90-day BAB yields was constructed by joining the files described above. The limited life of futures contracts requires ‘rolling over’ to the next contract as the near contract expires in order to create a long-term series of futures returns. Prior research has shown that rolling over at the expiry date induces spurious volatility and autocorrelation in futures returns10. As a robustness check against ‘expiry effects’, separate futures return series were constructed from price series rolled over at 1, 5, 10, 15 and 20 days before expiry. A month-end file containing the accumulation and price index (log) returns, five futures series (log) returns and one BAB yield was then constructed by summing daily data within each calendar month11. The final sample consists of a time-series of 25 months of data.
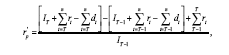
The return on the synthetic position is calculated by assuming the value of the index portfolio is invested in the fixed income security. This represents the same amount of funds that would be allocated among component stocks of the index portfolio had the investment taken place in the physical market. At this point one long SPI200 futures contract is bought. The investment in the fixed income security and the stock index futures contract combine to create the synthetic position. Mathematically the return on the synthetic portfolio is:
Where: 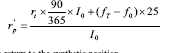
r’p is the return to the synthetic position
rt is the annual return on the risk free fixed income security
I0 is the price index at time 0 in dollars
(fT - f0) x 25 is the dollar gain / loss on the futures component of the synthetic position assuming the futures position is rolled at time T, approximately 90 days from time 0.
Relative performance of synthetic position
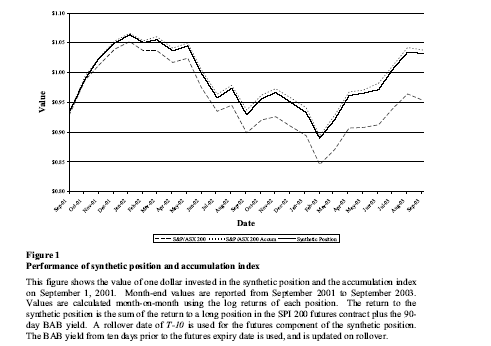
Figure 1 illustrates the value of one dollar invested in the synthetic position and the accumulation index on September 1, 2001. The return to the synthetic position is the sum of the return to a long position in the SPI 200 futures contract plus the 90-day BAB yield. Over the sample period, the synthetic position outperforms the price index strongly (which ignores dividends), and tracks the accumulation index closely, although there is evidence that it slightly underperforms. Prima facie, it appears that the synthetic portfolio returns the bulk of the dividend yield paid out by the index portfolio. A rollover date of T-10 for the futures is used12. It is possible that transaction costs associated with rollover of the futures component of the synthetic position in expiration months are adversely affecting the performance of the synthetic position13. Hence the sample is partitioned into expiration months (i.e., March, June, September and December) and non-expiration months.
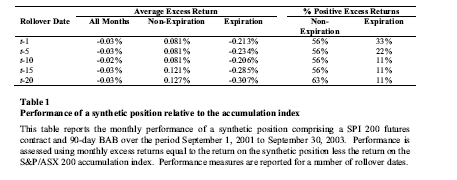
Excess returns equal to the difference between the synthetic position return and the accumulation index return are calculated to analyse the relative performance of the synthetic position. A positive excess return indicates that the synthetic position has outperformed the accumulation index, while negative excess returns indicate underperformance. Table 1 reports the average excess returns over the sample period for expiration and non-expiration months, separately and combined. Also reported are the proportion of months with a positive excess return, broken down by expiration and non-expiration months. Separate results are reported for each rollover date. (see Figure 1)
The results reported in Table 1 reveal substantial differences in performance between the synthetic position and the accumulation index. When all months are combined, the synthetic position slightly underperforms the accumulation index. Average excess returns in expiration months range from underperformance of 20.6 basis points to 30.7 basis points, depending on the rollover date used. Substantial underperformance in expiration months is likely due to the transaction costs incurred in rolling over the futures component of the synthetic position around expiry. However in non-expiration months, average excess returns vary from +8.1 basis points to +12.7 basis points - hence the synthetic position generally outperforms. The proportion of months with positive excess returns in non-expiration months also greatly exceeds that in expiration months. These results suggest that the synthetic position outperforms the accumulation index in non-expiration months, in fact, in almost two-thirds of the months examined. This could be due to the ability of the synthetic position to deliver the value of franking credits to investors (which are not included in returns based on the S&P/ASX200 Accumulation Index). A repeat test of the relationship between the synthetic return and the franking credit yield of the index follows.
Additional tests
If arbitrageurs are able to extract dividends as well as a proportion of franking credits from the index portfolio when holding an arbitrage position, the capital gain on the futures and hence the outperformance of the synthetic position relative to the accumulation index should be higher in months where franking credits are higher. In order to test this proposition, while controlling for transaction costs associated with rollover in expiration months, the following regression model was estimated:
Where: ![]()
rp,t is the return to the synthetic position in month t
rAI,t is the monthly return to the accumulation index in month t
ft is an estimate of the franking credit yield on the accumulation index in month t
Et is a dummy variable equal to one if month t is an expiry month, otherwise zero.
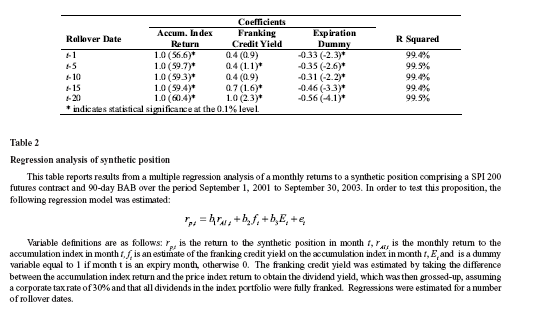
The franking credit yield was estimated by taking the difference between the accumulation index return and the price index return to obtain the dividend yield, which was then grossed-up, assuming a corporate tax rate of 30 percent and that all dividends in the index portfolio were fully franked.
Estimates of the model above can be used to assess whether the return on the synthetic position delivers the value of dividends and capital gains, in which case the coefficient should be close to one. Also, whether the return on the synthetic position is related to the franking credit yield of the index can be assessed by examining b2, which should be positive and significant if arbitrageurs can extract the value of franking credits from the index portfolio. Any underperformance during expiration months is captured in the coefficient b3.
Table 2 sets out the results of the analysis. As expected, the coefficient b1 is approximately equal to 1 and highly significant for all rollover dates, consistent with the proposition that the synthetic position delivers the value of dividends in addition to capital gains.
Two other very important results are reported in Table 2. First, there is evidence that the relationship between the performance of the synthetic position and the franking credit yield is positive and significant. The result implies that the synthetic position also delivers outperformance which is related to the value of franking credits paid out by the index, after controlling for expiration effects. Second, and importantly, the coefficients on the expiration dummy variable suggest that the synthetic position appears to significantly underperform by between 31 and 56 basis points in expiration months (depending on the rollover date).
Interestingly, one of the implications of the results is that franking credits are priced into stock index futures contracts despite the introduction of the 45-day rule in July 1997, which seemingly appear to prevent this. Under the 45-day rule, investors not holding stock continuously for 45 days around dividend payment periods are not entitled to franking credits14. If the 45-day rule is adhered to there should be no positive relationship between the return on the synthetic position and the franking credit yield. Arbitrageurs would not be entitled to franking credits on stocks held for less than 45 days and subsequently could not price them into the futures contract. However, there is anecdotal evidence suggesting that arbitrageurs are able to avoid the 45-day rule and extract the value of franking credits through carefully constructed transactions15. In the presence of such transactions there exists plausible justification for the pricing of franking credits into futures contracts and a positive and significant relationship between a synthetic portfolio and franking credit yield. The empirical evidence provided by this paper is therefore consistent with anecdotal evidence of avoidance of the 45-day rule.
This paper proves mathematically that returns on synthetic positions using stock index futures contracts and a fixed income security should deliver capital gains as well as the value of dividends derived by arbitrageurs. Consistent with this proposition, the empirical evidence provided in this paper reveals that a synthetic position comprising a long position in a stock index futures contract plus a bond, delivers the value of capital gains and dividends, plus a proportion of the value of franking credits. This is despite the provisions of the Income Tax Assessment Act (specifically, the 45-day rule), which intend to prevent arbitrageurs from obtaining the value of franking credits and consequently pricing them into the futures contract. The results also highlight that the adverse performance of the synthetic position in expiration months potentially negates any outperformance achieved in non-expiration months. The rollover strategy used is therefore a key factor in unlocking the full benefit of synthetic positions involving index futures. The findings in this paper also suggest that previous research which assesses the tracking efficiency of stock index futures contracts against price indices need to be revisited - returns from synthetic exposure need to be assessed against accumulation indices.
AustLII:
Copyright Policy
|
Disclaimers
|
Privacy Policy
|
Feedback
URL: http://www.austlii.edu.au/au/journals/JlLawFinMgmt/2004/2.html