
eJournal of Tax Research

|
|
Home
| Databases
| WorldLII
| Search
| Feedback
eJournal of Tax Research |
|
Ken Devos[∗]
The tax compliance behavioural literature indicates that among other factors, demographic variables play an important role in the compliance behaviour of taxpayers. This pilot study investigates the relationship that exists between demographic and other major tax compliance variables and the attitudes of students towards tax evasion and the penalties for tax evasion. A survey of 470 tertiary taxation students was recently conducted. The findings revealed that the demographic variables analysed including, gender, age, nationality, education/qualifications, occupation, and income level in most cases held statistically significant relationships with the incidence of tax evasion and the penalties for evasion. These results provide useful information for revenue collecting authorities and have implications for tax policy development.
The reasons for non-compliance in taxation raises important issues for any government and revenue collecting authority as it impacts on both the equity and efficiency of the economy. Measurement of the magnitude of non-compliance can be difficult as it involves estimating levels of uncollected tax, which by its nature is not detected by the revenue authority. Nevertheless the amount of tax lost through evasion is enormous (The IRS estimated it to be $US 127 billion[1] in 1996 and $US 310 billion[2] in 2004) and revenue authorities need to continually combat this if they are to provide the quality and quantity of public goods and services expected by its citizens. By examining the behavioural attitudes of different taxpayer groups (for example students) more closely, it is envisaged that governments may be able to bridge the tax gap and eventually improve community values and understanding with regard to tax compliance as well as targeting the audit strategies of Revenue Authorities in respect of non-compliers.
The aim of this study was to investigate if a relationship exists between demographic variables and the attitudes of Australian tertiary students towards tax evasion and the penalties for tax evasion. Specifically, the objectives of the survey were to ascertain demographic differences in:
However, the emphasis in the analysis of the results was based on objectives one, two and five in particular.
The remainder of the paper is structured in the following manner. Section 2 of the paper will define taxpayer compliance in terms of this analysis and attempt to briefly summarise some of the findings of empirical studies on tax compliance undertaken to date. Section 3 will then examine the specific demographic variables employed in this study and this will be followed by an outline of the research methodology in section 4. A discussion and preliminary analysis of the research results including statistical significance is provided in section 5 while section 6 concludes the study, identifying its limitations and provides suggestions for future research.
Taxpayer compliance has been defined as, compliance with reporting requirements, meaning that the taxpayer files all required tax returns at the proper time and that the returns accurately report tax liability in accordance with the internal revenue code, regulations and court decisions applicable at the time the return is filed.[3] An alternative definition has been offered by James and Alley[4] that considers tax compliance in terms of the tax gap. This is the difference between “true” individual income tax liability and that finally collected on a voluntary basis or by enforcement action. This definition has also been viewed as somewhat simplistic. Despite this there is no standard all embracing definition of compliance adopted across all tax compliance studies.
One of the major approaches to compliance relies upon the element of coercion represented by the enforcement activities of police, taxation officials as well as the sanctioning behaviour of the courts and other agencies. Although enforcement activities only indirectly effect compliance and direct enforcement against the individual engenders hostility, widespread failure to enforce creates cynicism and distorts reference norms.[5]
The Keith Committee[6] in England argued that enforcement powers should be precise and logically formulated, consistent across the range of taxation legislation, should allow for the minimum of administrative discretion and should be subject to ultimate judicial control which in turn should be capable of being applied in a summary and expeditious way.[7] Although the Keith Committee recommended that civil sanctions and surcharges should be the primary means of enforcing compliance, it argued that effective criminal sanctions should be available in cases of deliberate and serious frauds.[8]
Tax offences, however, have been treated as a special form of offending, quarantined from the general types of criminality, in that the non-enforcement of the law, together with the use of civil rather than criminal penalties has, in the past, allowed the taxation system to decay and fall into disrepute. Further, by allowing major illegalities to go unsanctioned, enforcement authorities have allowed the development of endemic cynicism and general disrespect for the law that may take years to reverse.[9] In terms of achieving a deterrent effect, enforcement authorities also appear to have failed in this regard.
However, some researchers have suggested that the whole notion of tax compliance is a social construct. They believe there is no objective standard of the appropriate levels of compliance and that the level “is a product of the negotiation of law and legal institutions.”[10] Tomasic and Pentony[11] argue that the notion of compliance is a political one so that what is perceived as an acceptable level of compliance at one time may not be acceptable at another.
The economic definition of taxpayer compliance views taxpayers as “a perfectly moral, risk neutral or risk adverse utility maximizing individual who chose to evade tax whenever the expected gain exceeded the cost.”[12] Thus a pure cost/benefit approach is given for why or why not taxpayers may comply with the tax laws. Other researchers propose that individuals are expected to weigh “the uncertain benefits of successful evasion against the risk of detection and punishment.”[13] Consequently a penalty structure has an impact upon compliance. Allingham and Sandmo published an early model of this theory.[14]
Studies of criminal behaviour in general have found that the probability of apprehension is more important than the sanctions actually imposed.[15] Yet another influence may be the precision of information regarding the probability that punishment will be imposed. Consequently, vague information about the relatively low probability of detection and punishment enhances the low deterrent value.[16]
On the other hand some studies have found that taxpayers are more sensitive to the magnitude of the penalty than to the probability of detection when the probability is very low (i.e. 4 % or less).[17] This could have implications for Anglo-Saxon countries that have moved to a self-assessment environment.[18] Other researchers have observed a significant relationship between the severity of the criminal sanctions and compliance by one group of taxpayers: high-income self-employed individuals.[19] This has also been supported by similar work on sanctions.[20] Within each of the groups this study covered, legal sanctions were most effective for the higher class and the better educated (not the best). These studies have also found that the threat of guilt feelings was a greater deterrent to tax evasion than the threats or stigma of legal sanctions.
Another potentially salient issue involves the existence of a threshold or the possibility of being detected. Threshold levels of detection may explain in part, inconsistent findings on the deterrent effects of the certainty versus the severity of punishment. Studies have provided evidence that states that in reaching a threshold probability of detection, mild punishment may be as effective a deterrent as a more severe one.[21] The severity of sanction does not necessarily produce a linear effect with tax compliance. Other authors submit that the social cost of sanctions could outweigh the benefits. Taxpayers as a group may become alienated if sanctions are perceived as too severe, resulting in general antagonism and disrespect for the law.[22]
However, the positive effect of increased sanction levels on taxpayer compliance has been found to hold up even where relatively low (and realistic) penalty levels are used.[23] What is of major concern though has been that taxpayers’ perceptions of the true penalty levels are higher than what the penalties actually are. This has tended to skew research findings. Other research evidence suggests that a tax system that combines both penalties and rewards is more effective in maximizing compliance than a system that focuses solely on sanctions.[24] As such, positive inducements for compliance may also have a key role to play. Whether these inducements come in the form of quicker tax refunds, or a percentage reduction in tax payable, is open to question.
The economic deterrence model has been used to examine tax evasion from a theoretical perspective and the fiscal psychology approach has often been used in empirical research. Factors that have been examined include:
The major works of Jackson and Milliron (1986) shows that there is no unanimous agreement on any one of these factors indicating a positive relationship with taxpayer compliance.
The traditional economic deterrence models draw upon deterrence theory and expected utility theory to predict that a rational taxpayer will evade tax as long as the payoff from evading is greater than the expected cost of being caught and punished. However, there is only ambiguous empirical evidence to support the predictions of economic deterrence models as a whole. Researchers[25] summarise the effect of factors that determine the monetary cost of compliance as including, the tax rate, detection probability, the level of income and penalty structure, and suggest for all of them, that existing empirical evidence provides no firm conclusions.[26]
On the other hand, social psychology models inductively examine the attitudes and beliefs of taxpayers in order to understand and predict human behaviour. Researchers indicate that taxpayer’s behaviour is directly determined by their intentions that are a function of their attitude towards behaviour and perception of social norms.[27]From a tax administration viewpoint, researchers[28] have concluded that compliance could also be improved, by educating taxpayers of their social responsibility to pay and thus their intention would be to comply.
As a behavioural problem the success of income tax depends on cooperation of the public, as suggested by Schmolders.[29] Consequently, there are greater gains in assisting compliant taxpayers meet their fiscal obligations rather than spending more resources pursuing the minority of non-compliers. Assisting taxpayers by improving the flow and quality of information or educating them into becoming more responsible citizens (eg TV campaigns) might yield greater revenue rather than if it were spent on enforcement activities. Some Anglo-Saxon revenue authorities support taxpayers through a range of easily accessible explanatory leaflets and provide a useful site on the internet.
The work of Hite[30] suggests that both gender and education impacts on taxpayer compliance. Hite points to an example where in reducing the amount of litter in America, instead of the authorities increasing penalties, the real improvement came when there was the slogan uplifted to keep “America Beautiful”.[31] Despite the difficulty of finding direct associations between compliance and these demographic variables, this area continues to be an active area of research within taxpayer compliance.
Other social and fiscal psychology models also effect compliance, by way of exchange equity (where taxpayers believe they are not receiving the benefits from the government in exchange for taxes paid). Although tax fairness is only one factor in achieving overall compliance, the NZ Government for example, has continuously placed great emphasis on this criterion.[32] Consequently fiscal psychologists, maintain that a taxpayer’s belief in the tax system rather than the penalty structure is more salient in generating compliance.[33]
Certainly considerable empirical research has been conducted to examine the link of perceptions of fairness and tax evasion, but the findings of various researchers therein are inconsistent. Nevertheless, the effect of demographic variables, such as, age, gender, marital status, education, culture and occupation have upon fairness perceptions ultimately affects compliance. The responsible citizen approach[34] also covers behavioural aspects of taxpayer compliance and includes the major works of Meier and Johnson,[35] and Jackson and Milliron.[36]
Indeed, much of the empirical work that has been carried out tends to refute the economic model of compliance in its basic form. For example, it has been demonstrated by means of laboratory experiments[37] that, even where the deterrence factor is so low that evasion makes obvious economic sense, some individuals will nevertheless comply. Such findings may be particularly relevant in the context of a self-assessment environment that operates in many western economies. Where random audits exist or where it is planned that only a small percentage of returns are selected for audit, a purely rational taxpayer would still be able to virtually discount audit as a serious deterrent factor.[38]
However, both American and British research indicates mixed results regarding the effectiveness of criminal punishment as a deterrent to non-compliance by taxpayers. That is, the level of punishment alone has not been the sole determinative factor in shaping the level of taxpayer compliance. There is a similar lack of consistency in the results of other studies testing the relationship of the probability and severity of penalties with the level of compliance.[39] Although overseas researchers have found general support for the idea that sanctions encourage compliance, there is conflicting evidence on the merits of legal sanctions and interpersonal sanctions. Furthermore the impact of the severity of sanctions was found to be unresolved.[40]
A proposal to increase criminal sanctions to reduce non-compliance could be considered consistent with the “economic man” model[41], which supposes that a rational taxpayer will attempt to evade taxes unless the risks of detection and punishment outweigh the benefits of tax savings.[42] The economic man model proposes that increasing punishment by expanding criminal sanctions would decrease non-compliance. This principle therefore supports sentencing theory and the courts’ right to consider the maximum penalty for an offence in order to achieve general deterrence.[43] However, this model has been criticised for failing to consider the analysis of attitudes, perceptions and moral judgements on tax behaviour.[44]
Earlier American research suggested that the threat of legal sanctions has an impact on compliance but not as great an impact as appealing to taxpayers’ consciences.[45] Researchers suggest that the evidence supports the proposition that compliance can be increased by threat of punishment, but appeals to conscience can be a more effective instrument than a sanction threat for securing compliance.[46]However, other researchers have found that the probability of criminal sanctions was not significantly related to compliance. In fact, as stated previously the severity of the criminal fraud penalty was significantly related to compliance in only one of three audit classes – high-income self-employed taxpayers. Consequently, the threat of new and increased sanctions may even have a negative effect on taxpayer compliance levels, if no impact at all.
Previous Australian research since the early 1980’s included the work of Wallschutzky[47] which indicated that the exchange relationship was the most important hypothesis explaining why taxpayers who evaded tax felt justified in doing so. In Wallschutzky’s study, a comparative analysis of the behaviours of tax evaders and those of the general population was conducted. Interestingly, the findings revealed that there was very little difference in the attitudes of both the evader group and the general population towards why people evade tax. In a later study by Wallschutzky[48] this notion was reinforced where findings revealed that some 86% of survey respondents considered that the level of income tax in relation to the level of government services was too high.[49] Some of the other findings from this study indicated that the burden of taxes was the main justification for increased levels of tax evasion and that tax advisers were perceived to have a significant impact upon taxpayers avoiding tax.
More recently both a qualitative and quantitative study by McKerchar[50] investigated the impact of complexity upon tax compliance focusing on Australian personal taxpayers. The findings revealed that the incidence of unintentional non-compliance and intentional over-compliance was high. Australian personal taxpayers appeared to be overpaying their tax liability as a result of complexity and these findings confirmed earlier overseas findings.[51] The clear message for the tax authority was that by addressing the effective simplicity of the tax system both the integrity and fairness of the tax system would be improved.
However, another recent study which investigated the impact of culture upon the perceptions of tax fairness and tax compliance was conducted by Gilligan and Richardson.[52] This empirical preliminary study of students from both Australian and Hong Kong universities revealed that there was no universal relationship or pattern that existed cross-culturally between the different facets of tax fairness perceptions and tax compliance. The authors indicated that legitimacy may well be the influence that shapes how fair tax systems are perceived and how likely people are to comply with their tax obligations.
Further studies conducted by Coleman and Wilkins,[53]revealed that there was a diversity of opinion and attitudes towards the tax system and compliance issues amongst the Australian public. One of the likely factors that could impede attitude change is the uneven level of comprehension or involvement in the tax system. This raises the issue of tax education and no doubt the impact of this variable in improving overall taxpayer compliance remains to be seen. Niemirowski, Baldwin and Wearing,[54] indicated that the results of tax evasion behavioural research over the last thirty years has remained contradictory and inconclusive. In the main this was due to the research addressing only a few variables at a time. Despite extensive research there was still a paucity of consistent reliable predicators or explanations of the causality of tax evasion.
Therefore given the various inconsistent findings in the studies to date outlined above, this study is considered a further valuable contribution to the literature. In particular the study will contribute to a better understanding of taxpayer compliance in Australia by establishing the relationship between demographic variables and the attitudes of tertiary students to tax evasion and the penalties for evasion. Understanding this relationship may consequently assist governments and Revenue Authorities in determining audit and compliance strategies and in the formulation and imposition of penalties for taxation offences.
A common finding amongst studies reviewed by Richardson and Sawyer and previously Jackson and Milliron[55] was that female taxpayers were more compliant than their male counterparts. In particular, a comprehensive study conducted by Oxley[56] in New Zealand reported that women were more often compliers in comparison with men and less often tax evaders or tax avoiders. However, Richardson and Sawyer noted that this compliance gap between males and females appears to be narrowing with the emergence of a more independent, non-traditional generation of women.[57] In a survey of American taxpayers Hite[58] focused on the interaction between gender and education. Female respondents with college degrees tended to be more tolerant of non-compliance than females without college degrees. On the contrary, males tended to be less tolerant of non-compliance as their education levels increased.
The majority of studies reviewed by Richardson and Sawyer[59] that examined the age variable found that older taxpayers tended to be more compliant than younger taxpayers.[60] However there have been a significant number of studies that have found no relationship.[61] Richardson and Sawyer have proposed four possible explanations for the inconsistent findings. Firstly, the significance of the age variable does not extend to all taxpayers. Second, inconsistent definitions of taxpayer non-compliance are employed throughout the research. Third, when age is considered in association with a number of other variables its effect on taxpayers’ compliance is diluted. Finally, the interaction of age with other compliance variables could be problematic.
There has only been little research undertaken with respect to tax compliance and ethnicity. A literature review by Roth et al[62] which used whites and non-whites as a proxy variable found whites to be more compliant. However, Beron et al [63] suggest the results are dependent upon other variables used in the study. In particular the income variable was found to have a distortive effect. Studies of commitment to compliance using indices have found the largest differences between races.[64]
The effect of education on taxpayer compliance is not clear, based on previous studies.[65] The reasons given for these conflicting findings are varied. First, there can be difficulty in determining which aspect of education is being measured. Comprehensive literature reviews[66] have identified four measures of education- the general degree of fiscal knowledge, knowledge involving evasion opportunities, general educational attainment and specific tax knowledge. These different dimensions may assist in explaining the confusion surrounding the effect that the education variable has on taxpayer compliance.
Correlations between education and other compliance variables may also have contributed to the inconsistent results found. Other possible compliance variables that have been suggested to have a relationship with education are gender,[67] income level,[68] ethics,[69] taxpayers’ perceptions of fairness,[70]detection[71]and sanctions.[72] Nevertheless, it is important that university students’ attitudes to tax be examined because firstly, young people have many years of taxpaying left and secondly, graduates tend to earn more over their lifetimes than non-graduates. Consequently graduates represent a larger proportionate share of the tax base in terms of per-head taxable income.[73]
There is a lack of clear research direction for occupation and employment status as variables contributing to taxpayers’ compliance behaviour.[74] The reasons for this lack of clarity could be that many studies employ different occupational categories in their research. These occupational categories have ranged from specific occupational strata[75] to broad categories[76]. Another reason for the lack of direction could be the suggestion that the opportunities for non-compliance are associated with the particular occupation rather than the occupation itself.[77] Consequently, further research needs to be done utilising occupation as an independent variable.
Recent research has confirmed earlier findings of Jackson and Milliron,[78] that the evidence on the income level variable is mixed and unclear.[79] Previous research has found supporting evidence for three contrasting views encompassing positive,[80] negative[81] and no correlation[82] with taxpayer compliance. It is possible that correlations between income level and other tax compliance variables, in particular the effect of tax rates, may explain why the findings are so inconclusive.[83]
There appears to be a lack of research into the relationship between work experience and tax return filing experience as independent variables and taxpayer compliance. One reason for this situation could be the interaction that these variables have with other independent variables. For example, variables such as age, income level, and occupation are intuitively linked to work experience and consequently tax return filing experience. A study by Tan,[84] tested the effects of working and filing status of taxpayers’ with their perceptions of fairness of the tax system. The findings indicate that both variables have an effect on the perception of fairness of the tax rate structure and filing status has an effect on the perception of fairness of the tax burden on different income levels.
A survey questionnaire was used to ascertain tertiary students’ attitudes towards tax evasion and the penalties for tax evasion. The strength of this approach is that it enables a large number of respondents to be surveyed with minium expense. Approval was sought and obtained from the requisite human ethics committee given the sensitivity of the information being requested. Responses to the survey were confidential and no names were given by participants. The survey was eight pages in length and took respondents approximately 15-20 minutes to complete. In most questions a seven-point Likert scale was employed to indicate the degree of agreement or disagreement. A copy of this pilot survey was given to experienced researchers and the statistical counselling service of the Business and Economics Faculty, at Monash University for suggestions on improving the instrument. It was considered that the survey questions appeared to be well understood with little opportunity for confusion.
The survey contained 31 questions[85] which included, (See Appendix 1) Questions 1-2 that asked respondents for their sources and quality of tax information. Questions 3 to 6 asked respondents for their impressions and beliefs regarding the imposition of tax penalties in certain hypothetical scenarios. Questions 7-11 asked respondents if they had ever been fined and penalized for tax offences themselves and their impressions thereof. Questions 12-14 sought respondents’ views on law enforcement while questions 15-16 sought their views regarding tax fairness and questions 17-23 their views concerning tax morals. Questions 24-31 concluded the survey by asking respondents for their demographic details. Finally, there was also space provided in the survey to give respondents an opportunity for comments.
The survey was distributed to 420 undergraduate and 50 postgraduate taxation law students at Monash University, Clayton campus, during March-April 2005. The majority of respondents were full-time students as expected, although there were also respondents from industry, accounting firms and other administrative positions. Consequently as the sample was not representative of the whole taxpayer population the findings need to be appropriately qualified. It is proposed however, that a final version of this survey instrument may be utilised by the ATO in the future which could be distributed amongst a more representative sample of the taxpayer population. For this study, 306 completed surveys were received, giving a response rate of 65%. It is considered that a response rate of anything over 30% in a tax survey is acceptable given the sensitive nature of the topic and the response rate of previous tax compliance surveys.[86] In some questions the response rate was less than 300 but the results were nevertheless included in the analysis.
Chi-square tests were employed to investigate the effect of demographic variables on selected survey questions (See Appendix 2). Independent variables included age, gender, nationality, qualification (level of education), occupation, and income level. These are the most common demographic variables used in tax compliance research. Although information was also gathered on taxpayers’ work and tax filing experience this was not analysed. Specifically, survey questions three, four, six, sixteen and nineteen were analysed in the paper against the demographic variables. These questions represented the thrust of the study in terms of tax penalties, taxpayers’ attitudes towards tax evasion and their attitudes regarding tax morals and tax fairness. The demographic variables employed were tested for statistical significance at the 5 per cent level. (ie statistically significant at p= 0.05)
In particular three categories of significance were used. The first category was where the empirical value was less than or equal to 0.05 (p< or =0.05) was significant. That is the results were less likely to be due to chance. The second category was marginally significant where the empirical value was greater than 0.05 but less than 0.15 (0.05<p< 0.15). The third category was insignificant where the empirical value was greater than 0.15 (p> 0.15). Consequently, in this category there was no relationship between the variables. It should be noted that the depending on the number of degrees of freedom (df), it is important that the numbers in each cell are large enough to make chi-square tests appropriate. That is, chi-square tests should not be used where more than 20 percent of the expected frequencies are smaller than five or when any expected frequency is less than one[87]. Given this qualification, chi-square tests were carried out accordingly. The frequencies and percentage breakdown of responses to all questions was also examined to enable comparisons with other studies[88]. (See Tables 1-12 below.)
|
Respondents Opinion
|
None (1-2)
|
Some (3-5)
|
A lot (6-7)
|
Total Reponses
|
|
Q1 How much information about tax issues do you receive from the
following sources?
a The ATO
|
142 (47%)
|
144 (47%)
|
18 (6%)
|
304 (100%)
|
|
b. tax practitioners
|
210 (70%)
|
75 (25%)
|
17 (5%)
|
302 (100%)
|
|
c. work-related publications
|
172 (57%)
|
115 (38%)
|
16 (5%)
|
303 (100%)
|
|
d. TV, radio, newspapers
|
111(36%)
|
173 (57%)
|
20 (7%)
|
304 (100%)
|
|
e. family and friends
|
84 (28%)
|
185 (61%)
|
36 (11%)
|
305 (100%)
|
|
Q2 Depending on which source was most informative how much information
did you receive on
a. how to do your tax return
|
92 (30%)
|
146 (48%)
|
67 (22%)
|
305 (100%)
|
|
b. what will trigger an audit
|
164 (54%)
|
122 (40%)
|
17 (6%)
|
303 (100%)
|
|
c. what the ATO is able to catch
|
151 (50%)
|
134 (44%)
|
19(6%)
|
304(100%)
|
|
d. what the penalties are for evasion
|
138 (46%)
|
145 (48%)
|
19 (6%)
|
302 (100%)
|
|
e. people having problems with the ATO
|
155 (51%)
|
136 (45%)
|
12 (4%)
|
303 (100%)
|
|
f. people outwitting the ATO
|
163 (54%)
|
129 (43%)
|
9 (3%)
|
301 (100%)
|
In Table 1 questions 1 and 2 asked respondents about the sources and quality of the tax information they receive. The aim of these questions was just to give some broad indication of the respondents’ awareness of tax issues. It was evident that family and friends and to a lesser degree the media were the most common sources of tax information providing some 36 cases (11% of the respondents a lot of the time). The media provided some tax information (< 10%) while in most cases tax practitioners were least informative. (210 cases or 70% of total respondents’ received no information).
Given that family and friends were the most informative in the majority of cases (221 cases or 72% of respondents) the type of information received was mainly in regard to preparation of tax returns (70%). Only in less than 10% of cases was there a lot of information relating to the penalties for tax evasion or people having problems with or outwitting the ATO and audits. The lack of public education in this regard may well be a major factor in explaining the causes of tax evasion and can be linked to the behavioural factors of taxpayers outlined in the literature review.[89]
|
Respondents Opinion
|
Very Mild
(1-2)
|
Right Amount
(3-5)
|
Very Severe
(6-7)
|
Total Reponses
|
|
Q3 a. Trades person underreporting cash earnings
|
36 (13%)
|
227 (77%)
|
30 (10%)
|
293 (100%)
|
|
b. An academic exaggerating deduction claims
|
42 (15%)
|
222 (77%)
|
26 (8%)
|
290 (100%)
|
|
c. small business owner not paying tax debts
|
25 (9%)
|
226 (77%)
|
41 (14%)
|
292 (100%)
|
|
d. a large corporation shifting profits abroad.
|
53 (18%)
|
173 (60%)
|
63 (22%)
|
289 (100%)
|
|
e. a welfare recipient under declaring government payments
|
47 (16%)
|
204 (70%)
|
39 (14%)
|
290 (100%)
|
|
f. a manager underreporting taxes
|
33 (11%)
|
212 (73%)
|
45 (16%)
|
290 (100%)
|
|
g. a student part-time worker failing to lodge a tax return
|
63 (23%)
|
182 (63%)
|
45 (16%)
|
290 (100%)
|
|
h. a retiree under declaring investment income
|
53 (18%)
|
214 (74%)
|
22 (8%)
|
289 (100%)
|
In Table 2 question 3 asked respondents to describe the penalties used by the ATO for various occupational groups. The actual penalties for various tax offences were not specifically explained to the students other than what they had learned in class. Although the question was aimed to get the respondents’ views as to what they thought the penalty should be for the type of tax offender, it was evident that lack of penalty information and understanding was probably a short coming of the question. The following question provided examples of the penalties that are likely to be imposed.
However in most cases respondents felt the penalties were appropriate. Specifically, 22% indicated that the penalties used against a large corporation shifting profits abroad were very severe. Interestingly, (23%) of respondents indicated that the penalties imposed on students and part-time workers failing to lodge were mild. The majority (77%) indicated the penalties imposed on small business owners and managers who underreport tax were about the right amount. The responses for penalties imposed on retirees under declaring and tradespersons underreporting income however, appeared to be indifferent Chi-square tests revealed a significant difference at 5% confidence level between age and acceptability of penalty for a trades person underreporting cash earnings (X2 = 150.270, df =120 p= 0.032).
Education was also found to be significant for the appropriateness of penalties on small business owners not paying their tax debts (X2 =31.412, df=18, p= 0.026). Other significant findings were occupation and penalties for welfare recipients under- declaring government payments (X2 = 212.607, df = 180, p= 0.049.) and education and penalties for managers underreporting taxes (X2 = 33.036, df= 18, p= 0.017.) Marginally significant results include, income level and the penalties for small business owners not paying tax debts (X2 = 71.936, df= 60, p= 0.139.) Interestingly income level and the penalties for an academic exaggerating deductions was insignificant (X2 =25.829, df =60, p= 1.000).
|
Respondents Opinion
|
(1)
|
(2)
|
(3)
|
(4)
|
(5)
|
(6)
|
Total
|
|
4a)Monetary Fine
|
< $5,000
|
$5,000
|
$10,000
|
$15,000
|
$20,000
|
>$20,000
|
|
|
34 (12%)
|
37 (13%)
|
65 (23%)
|
53 (19%)
|
50 (18%)
|
44 (15%)
|
283 (100%)
|
|
|
b) A Prison Sentence
|
< 1 week
|
1 week
|
2 weeks
|
3 weeks
|
4 weeks
|
>4 weeks
|
|
|
1 (2%)
|
10(17%)
|
12(20%)
|
7(12%)
|
17(29%)
|
12 (20%)
|
59 (100%)
|
|
|
c) Community Service
|
< 1 week
|
1 week
|
2 weeks
|
3 weeks
|
4 weeks
|
>4 weeks
|
|
|
6 (4%)
|
22 (13%)
|
35(21%)
|
19 (12%)
|
41(25%)
|
42 (25%)
|
165 (100%)
|
|
|
d)Education Program
|
<3 days
|
3 days
|
6 days
|
9 days
|
12 days
|
>12 days
|
|
|
17 (9%)
|
43(22%)
|
52(26%)
|
17(9%)
|
23 (12%)
|
45 (22%)
|
197 (100%)
|
In Table 3 question 4 asked respondents for their opinions on a hypothetical scenario of a business owner (X) who negotiated discounts for customers in return for being paid in cash. The majority (50%) indicated that a community service order of 4 weeks or more was the best penalty. Also 60% indicated that a monetary fine in the range of $10,000-$20,000 would be appropriate. Otherwise, chi square tests generally revealed insignificant results. Educational programs indicating between 3-12 days (69%) were a popular response and there was a statistically significant difference between occupation and educational programs (X2 = 224.744, df =180 p= 0.013). It was also interesting to note that a prison sentence was only marginally significant for gender (X2 = 19.787, df =12 p= 0.071), Age (X2 = 129.878, df =114 p= 0.147) and education (X2 = 24.817, df =18 p= 0.130). The findings are consistent with Hite (1997), regarding the impact of gender and education upon tax compliance.
In Table 4 question 5 stated that given the business owner (X) in Q 4 had to pay a fine or penalty, respondents were asked questions of what they thought of this. The results indicate that between 35-40% believed that the business owner X was personally responsible and generally knew of the consequences. The majority (65%) were unsure whether this tax evasion was a serious offence (ie deliberate or intentional evasion). The survey did not consider other types of offences with which to compare these results but in terms of taxpayers’ perceptions the findings are consistent with those of Karlinsky.[90]
|
Respondents Opinion
|
Not at All
(1-2)
|
Neutral
(3-5)
|
Very Much
(6-7)
|
Total Reponses
|
|
Q5 Assume Business Owner X had to pay a substantial fine.
a. Do you think X deserves harsh punishment?
|
28(9%)
|
201(66%)
|
76 (25%)
|
305 (100%)
|
|
b. Do you think X was personally responsible for receiving the
penalty?
|
12 (4%)
|
173 (57%)
|
118 (39%)
|
303 (100%)
|
|
c. Do you think X knew of the possible consequences of his/her
evasion?
|
36 (12%)
|
159 (52%)
|
109 (36%)
|
304(100%)
|
|
d. Do you think X was justified in reducing tax?
|
89 (30%)
|
192 (63%)
|
22 (7%)
|
303(100%)
|
|
e. Do you think X tax evasion is a serious offence?
|
28 (9%)
|
196 (65%)
|
80 (26%)
|
304 (100%)
|
|
Q6 Assume you are the business owner and had to pay a substantial fine.
How likely is it that you would
a feel that what you had done was wrong
|
36 (12%)
|
174(58%)
|
92 (30%)
|
302 (100%)
|
|
b. feel sorry/remorseful
|
57(19%)
|
179(59%)
|
66(22%)
|
302 (100%)
|
|
c. Ignore the penalty and take the risk
|
165 (55%)
|
111(37%)
|
22 (8%)
|
298(100%)
|
|
d. feel like you had won if you had got away without paying the fine
|
60(21%)
|
145 (50%)
|
87(29%)
|
292(100%)
|
|
e. resent the ATO having control over you
|
61(20%)
|
181 (60%)
|
60(20%)
|
302 (100%)
|
Question 6 then asked respondents to assume that they were the business owner who had been fined or penalized and what they thought about it. Some 30% would feel guilty about their wrongdoing, although 29% would have felt victorious if they had got away with it. A clear risk averse attitude was displayed by 55% of respondents who refuse to ignore the penalty and take the risk. Three demographic variables held significant relationships according to chi-square tests. Firstly, gender was clearly linked to respondents feeling sorry and remorseful (X2 = 28.476, df =12 p= 0.005), ignoring the penalty and taking the risk (X2 = 23.538, df =12 p= 0.023) and the feeling of escaping (X2 = 25.472, df =12 p= 0.013). Secondly, nationality was significant with respect to the ATO having control over them (X2 = 246.159, df =186 p= 0.002) and with respect to feeling sorry and remorseful (X2 = 217.078, df =186 p= 0.059). Thirdly, income level and the variable of ignoring the penalty and taking the risk was significant (X2 = 79.119, df =60 p= 0.050). Marginally significant results include education and the penalty for risk taking, (X2 = 27.281, df =18 p= 0.074) and education and feelings of escaping from the penalty (X2 = 24.298, df =18 p= 0.127). These results have implications regarding the potential deterrent effect of penalties for tax evasion.
|
Respondents Reasons
|
Penalty imposed
|
Penalty not imposed
|
|
Q7 Have you ever been fined or penalized in some way?
|
5 (2%)
|
291(98%)
|
|
Q8 If yes, for what type of offence? eg
|
|
|
|
1 making a false or misleading statement
|
3
|
|
|
2.Obtaining a financial advantage by deceiving the Commonwealth or Public
Authority
|
|
|
|
3. Defrauding the Commonwealth
|
1
|
|
|
4. failure to withhold and remit tax
|
1
|
|
|
5.Other
|
|
|
In Table 5 question 7 asked respondents whether they had been fined or penalized in some way by the ATO and positive responses were received in only 5 cases (2%). The majority 291 cases (98%) skipped to question 12. It is possible that question 7 may have also caused some confusion with respondents still answering questions 8-11 accidentally. In response to question 8, four cases involved civil offences including making errors on BAS returns, and failing to withhold and remit tax. Interestingly, there was one omission of a criminal offence of defrauding the Commonwealth. This supports the fact that evaders are prepared to reveal details if they feel comfortable with the anonymity of the survey instrument.[91]
|
Respondents Opinion
|
(1) –(2)
|
(3)-(5)
|
(6)-(7)
|
Total
Responses
|
|
Q9 The ATO’s Decision to penalize you;
|
Absolutely Unfair
|
Indifferent
|
Absolutely Fair
|
|
|
|
0
|
5 (100%)
|
0
|
5(100%)
|
|
Q10 The penalties against you were
|
Very Mild
|
About Right
|
Very Severe
|
|
|
|
0
|
5(100%)
|
0
|
5(100%)
|
|
Q11 Were the reasons for the penalty clear or unclear to you
|
Totally clear
|
Neutral
|
Totally Unclear
|
|
|
|
3(60%)
|
2(40%)
|
0
|
5(100%)
|
In Table 6 the response to question 9, all five cases were generally indifferent to the ATO s’ decision to penalize them being unfair indicating a 3-5 rating on the seven point Likert scale. In response to question 10, the penalties were about right. Answers to question 11, the majority of respondents (60%) felt that the reasons for the penalties were clear although 40% were also neutral in this regard.
|
Respondents Opinion
|
Strongly Disagree
(1-2)
|
Neither Agree or Disagree
(3-5)
|
Strongly Agree
(6-7)
|
Total Reponses
|
|
Q12 a The prospect of tough penalties would deter people from
evading tax
|
22(8%)
|
174(57%)
|
107(35%)
|
303(100%)
|
|
b Teaching tax evaders to deal effectively with their taxes would reduce
future offences
|
29(10%)
|
192 (63%)
|
82(27%)
|
303(100%)
|
|
Q13 a. Tax evasion could be best handled through informing and
encouraging taxpayers to comply voluntarily
|
48(16%)
|
199(66%)
|
56(18%)
|
303(100%)
|
|
b. Through enforcing strict rules and disciplining the guilty
|
14(4%)
|
192(63%)
|
99 (33%)
|
303(100%)
|
|
c. Though exposing people who cheat the tax system
|
61(20%)
|
157(53%)
|
81(27%)
|
299(100%)
|
|
d. Providing incentives for paying the correct amount of tax
|
14 (4%)
|
130(43%)
|
159 (52%)
|
303(100%)
|
|
Q14 a. The ATO can be trusted to administer the tax system so that
it is good for the country as a whole
|
20(7%)
|
221(73%)
|
60(20%)
|
301(100%)
|
|
b. The ATO tries to be fair when making their decisions
|
28(9%)
|
239(80%)
|
33(11%)
|
300(100%)
|
|
c. People should follow the decisions of the ATO even if they go against
what they think is right
|
48(16%)
|
217(72%)
|
36 (12%)
|
301(100%)
|
|
d. The ATO effectively upholds the principles of equal rights and
opportunities.
|
34 (11%)
|
227(76%)
|
38(13%)
|
299(100%)
|
In Table 7 questions 12-14 were aimed at gauging respondents’ opinions on law enforcement. In particular question 12 indicated that respondents felt tough penalties (35%) and taxpayer education (27%) would reduce tax evasion, with a higher percentage neither, agreeing or disagreeing. The results in question 13 reinforced this view with 18% indicating that voluntary compliance should be encouraged, along with 33% indicating that strict rules and disciplining the guilty are still important. Respondents were indifferent when queried about exposing tax cheats. Interestingly, 52% of the respondents agreed to providing incentives for taxpayer compliance and paying the correct amount of tax. This is consistent with views put forward by James and Alley.[92]
The majority of respondents (73%) neither agreed nor disagreed regarding trusting the ATO to administer the tax system fairly. Likewise (72%) were indifferent to people following the decisions of the ATO against their will or that the ATO upheld the principles of equal rights and opportunities (76%).
|
Respondents opinion
|
Too Few
(1-2)
|
Right Amount
(3-5)
|
Too Many
(6-7)
|
Total Reponses
|
|
Q15 Personally, how many opportunities do you have to reduce your
tax?
|
126(42%)
|
167(57%)
|
4(1%)
|
297 (100%)
|
|
Q16 In your opinion, do the following groups have many opportunities to
legally reduce their tax?
a. Chief executives of large corporations
|
18(6%)
|
167(56%)
|
111(38%)
|
296(100%)
|
|
b. Judges and barristers
|
13(4%)
|
184(62%)
|
98(34%)
|
295 (100%)
|
|
c. Unskilled factory workers
|
138(46%)
|
145(49%)
|
16(5%)
|
299(100%)
|
|
d. Trades people
|
37(12%)
|
210(70%)
|
52(18%)
|
299(100%)
|
|
e. Clerical workers
|
52(18%)
|
234(78%)
|
13(4%)
|
299(100%)
|
|
f. Small business owners
|
35(12%)
|
224(75%)
|
40(13%)
|
299(100%)
|
In Table 8 questions 15-16 were aimed at gauging respondents’ opinions on tax fairness. In most cases the majority of respondents believed that all occupations listed had the right amount of opportunity to legally reduce their tax. However, 34% of respondents believed judges and barristers have too many opportunities while 46% indicated that unskilled factory workers had too few opportunities. This may largely be due to the ability of professions to afford quality tax advice.
Chi-Square Tests revealed significant differences between gender and corporate CEOs’ opportunities to reduce tax (X2 = 25.592, df =12 p= 0.012) also nationality and judges’ and barristers’ opportunities to reduce tax (X2 = 218.982, df =186 p= 0.049) and between age and tradespeoples’ opportunities to reduce tax (X2 = 152.967, df =120 p= 0.023). Generally other results were only marginally significant with totally insignificant results appearing for clerical workers’ opportunity to reduce tax against nationality (X2 = 124.928, df =186 p= 1.000) and against occupation (X2 = 97.818, df =180 p= 1.000).
In Table 9 questions 17 -19 were aimed at gauging respondents’ opinions about tax morals. In question 17 the majority (ranging from 44-69%) all felt that their individuality, their profession or industry, the Australian community and being an honest taxpayer were all as important as each other. Question 18 revealed the majority were indifferent with respect to all income being declared on a tax return (55%) and that it is acceptable to overstate tax deductions (69%). Respondents were also generally neutral regarding the triviality of cash in hand jobs (59%).
The majority of respondents were generally neutral with regard to the variety of reasons given for evading tax. Although 42% clearly indicated that they would not see it as a game against the ATO and thought they would get away with it. Also 34% indicated that they would not evade because of a bad experience with the ATO or want to get even, while 29% gave reasons of compensation and 25% the reason of self–interest. Chi-square tests reveal that age, (X2 = 147.371, df =114 p= 0.019) nationality (X2 = 213.931, df =180 p= 0.043) and education (X2 = 28.884, df =18 p= 0.050) all had a significant relationship with compensating oneself for evading tax. This is consistent with the equity arguments presented earlier by Tan[93]. The reason of self-interest was insignificant, but wanting to get even with the ATO was significant, for gender, (X2 = 26.044, df =12 p= 0.011) and income level (X2 = 85.629, df =60 p= 0.017). A significant result was also reported for gender (X2 = 21.056, df =12 p= 0.050) and nationality (X2 = 217.582 df =180 p= 0.029) and the rationality for evading tax.
|
Respondents Opinion
|
Not at all
(1-2)
|
Neutral
(3-5)
|
Very Much
(6-7)
|
Total Reponses
|
|
Q17 What is important to you?
a. Your individuality
|
4(2%)
|
117(44%)
|
145(54%)
|
266(100%)
|
|
b. Your Profession Industry
|
2(1%)
|
158(53%)
|
137(46%)
|
297(100%)
|
|
c. The Australian Community
|
17(6%)
|
204(69%)
|
75(25%)
|
296(100%)
|
|
d. Being an honest taxpayer
|
35(12%)
|
190(64%)
|
71(24%)
|
296(100%)
|
|
Q18 These questions ask you what you think
a. Do YOU think one should honestly declare all income on one’s tax
return?
|
26(9%)
|
165(55%)
|
107(36%)
|
298(100%)
|
|
b. Do YOU think it is acceptable to overstate tax deductions on ones tax
return?
|
68(23%)
|
207(69%)
|
23(8%)
|
298(100%)
|
|
c. Do YOU think working for cash in hand payments without paying tax is a
trivial offence?
|
66(22%)
|
175(59%)
|
57(19%)
|
298(100%)
|
|
Q19 If you ever evaded tax what would be your main reason for doing
so?
a. I would want to compensate myself for being unfairly disadvantaged by
the tax system
|
33(11%)
|
177(60%)
|
87(29%)
|
297(100%)
|
|
b. I would look after my own interests first, as everyone else does
|
26(9%)
|
195(66%)
|
76(25%)
|
297(100%)
|
|
c. I would see it as a game against the ATO and thought I would get away
with it
|
125(42%)
|
152(51%)
|
20(7%)
|
297(100%)
|
|
d. I would find it rational to get the most out of any situation
|
27(9%)
|
187(64%)
|
80(27%)
|
294(100%)
|
|
e. I would have had a bad experience against the ATO and would want to get
even.
|
101(34%)
|
171(58%)
|
23(8%)
|
295(100%)
|
|
Respondents Reasons
|
Tax Agent engaged (1)
|
Tax Agent not engaged (2)
|
|
Q20 Did you rely on a tax agent or advisor in preparing your most recent
income tax return?
|
69 (25%)
|
213 (75%)
|
|
Q21 Primary reason for using a tax agent
|
|
|
|
1.Fear of making a mistake
|
16 (23%)
|
|
|
2.The tax system is too complex
|
13 (19%)
|
|
|
3.Insufficient time to prepare my own return
|
7 (10%)
|
|
|
4.To legitimately minimize the tax I had to pay
|
29 (42%)
|
|
|
5. To avoid paying tax
|
4(6%)
|
|
In Table 10 questions 20 and 21 were asked to find out how many respondents engaged a tax agent or advisor and if so, why. The results reveal that only (25%) of the sample engaged a tax agent and that for half of them (42%) the main reason was for being able to legitimately minimize the amount of tax paid. This finding needs to be qualified however, when this percentage of tax agent use is compared to the use of tax agents by the general population. For instance, in a study conducted by McKerchar,[94] it was found that agent-lodged returns accounted for almost 75% of the total lodgements by personal taxpayers. Based on the figures in that study presented for tax agent lodgements up to 2001, it appears a high reliance on tax agents by Australian taxpayers still exists. Consequently the findings of this survey with regard to engaging a tax agent are unrepresentative of the Australian taxpayer population.
As the majority of respondents were full-time students this may account for 75% of participants not having to lodge a tax return and therefore engaging a tax agent. However, for those who did engage an agent the findings reveal that to legitimately minimise the amount of tax they had to pay (42%), followed by the fear of making a mistake (23%) and the complexity of the system (19%) were the main reasons given for doing so. It is also interesting to note that there were only 4 cases of employing an agent for the sole purpose of avoiding tax. This may again be evidence of the honesty of respondents in completing the survey.
In Table 11 question 22, respondents were given a scenario where a tax agent advised them as to the deductibility of an ambiguous expense. The tax agent also advised that there would be a low probability that the tax return would be audited and if so, the penalty would be mild. Given that the tax agent advises not to claim, the majority of respondents 54%, stated that they would be indifferent while 47% would probably agree with the agent and further 11% would definitely also agree. Likewise 35% would probably continue to use the same agent. However, interestingly in question 23 where the tax agent advises to claim the ambiguous deduction the majority, although smaller, 42% would again probably agree with the agent’s advice and continue to use the same agent 38%. In only 3% of the cases were respondents definitely or 16% probably not going to agree with or use the same agent in question 23.
|
Respondents Opinion
|
Definitely Yes (1)
|
Probably Yes (2)
|
Neutral
(3)
|
Probably No(4)
|
Definitely No(5)
|
Total
Responses
|
|
Q22 The Tax Agent advises you NOT TO CLAIM the deduction on your return
a. Would you agree with the tax agent’s advice?
|
31(11%)
|
136(47%)
|
54(18%)
|
63(22%)
|
8(2%)
|
292(100%)
|
|
b Based on the Tax agents advice would you continue to use this
agent?
|
24(8%)
|
101(35%)
|
83(28%)
|
72(25%)
|
12(4%)
|
292(100%)
|
|
Q23 Now the Tax Agent advises you TO CLAIM the deduction on your return
a. Would you agree with the tax agent’s advice?
|
30(10%)
|
122(42%)
|
93(32%)
|
44(15%)
|
4(1%)
|
293(100%)
|
|
b Based on the Tax agents advice would you continue to use this
agent?
|
26(9%)
|
110(38%)
|
101(34%)
|
48(16%)
|
8(3%)
|
293(100%)
|
|
Q24. Gender
|
Frequency
|
Percentage
|
|
Female
|
186
|
61%
|
|
Male
|
120
|
39%
|
|
Total
|
306
|
100%
|
|
|
|
|
|
Q25 Age
|
Frequency
|
Percentage
|
|
15-19
|
44
|
14%
|
|
20-29
|
245
|
80%
|
|
30-39
|
15
|
5%
|
|
40-49
|
2
|
1%
|
|
50-59
|
0
|
0
|
|
60-69
|
0
|
0
|
|
70+
|
0
|
0
|
|
Total
|
306
|
100%
|
|
|
|
|
|
Q 26. Nationality
|
Frequency
|
Percentage
|
|
Australian
|
115
|
38%
|
|
Chinese(including HK)
|
68
|
22%
|
|
Non-Chinese Asian
|
88
|
29%
|
|
British/NZ
|
3
|
1%
|
|
European
|
4
|
1%
|
|
Other
|
28
|
9%
|
|
Total
|
306
|
100%
|
|
|
|
|
|
Q 27. Qualification (Level of Education)
|
Frequency
|
Percentage
|
|
Did not have any or much formal schooling
|
0
|
0
|
|
Primary School
|
0
|
0
|
|
Junior /Intermediate/Form 4/Year 10
|
0
|
0
|
|
Secondary/ Leaving/ Form 6/ Year 12
|
96
|
31%
|
|
Trade Certificate/ Nursing Diploma
|
0
|
0
|
|
Diploma Course
|
37
|
12%
|
|
University Tertiary Degree
|
170
|
57%*
|
|
Post graduate Degree
|
3
|
1%
|
|
Total
|
306
|
100%
|
|
|
|
|
|
Q 28. Occupation
|
Frequency
|
Percentage
|
|
Professional/Management
|
7
|
2%
|
|
Student
|
253
|
83%
|
|
Administrative/Accounting
|
33
|
11%
|
|
Trades Person
|
0
|
0
|
|
Social Work/teaching
|
2
|
0.6%
|
|
Service Industry (Sales)
|
7
|
2%
|
|
Other- not working
|
2
|
0.7%
|
|
Other – working
|
2
|
0.7%
|
|
Total
|
306
|
100%
|
|
|
|
|
|
Q 29 Personal Income
|
Frequency
|
Percentage
|
|
Zero income
|
129
|
42%
|
|
$1-$5,000
|
10
|
3%
|
|
$5,001-$10,000
|
79
|
26%
|
|
$10,001- $20,000
|
26
|
9%
|
|
$20,001-$30,000
|
13
|
4%
|
|
$30,001-$40,000
|
12
|
4%
|
|
$40,001 -$50,000
|
10
|
3%
|
|
$50,001or more
|
27
|
9%
|
|
Total
|
306
|
100%
|
|
|
|
|
|
Q 30. Employment Status
|
Frequency
|
Percentage
|
|
Unemployed
|
14
|
5%
|
|
Retired from paid work
|
0
|
0%
|
|
Full-time Student
|
186
|
61%
|
|
Keeping House
|
2
|
1%
|
|
Other
|
5
|
2%
|
|
Employed
|
99
|
31%
|
|
Total
|
306
|
100%
|
|
|
|
|
|
Q31 Last Tax Returned Lodged
|
Frequency
|
Percentage
|
|
2003/04 year
|
138
|
45%
|
|
2002/03 year
|
20
|
6.7%
|
|
2001/02 year
|
3
|
1%
|
|
2000/01 year
|
1
|
0.3%
|
|
Not lodged in last 5 years
|
144
|
47%
|
|
Total
|
306
|
100%
|
* As the majority of students surveyed were in their final year of a degree course they interpreted Q27, the level of education, as having completed their undergraduate degree.
The demographic profile of the sample was skewed and not representative of the population, however, for the purposes of a pilot test nevertheless, useful. Specifically, the results of question 24 revealed that 186 (61%) females and 120 (39%) of males completed the survey. Question 25 indicated that the greatest portion of the respondents fell into the 20-29 age-group. (80%) This is not surprising considering the majority of respondents were full-time students (83%) and only likely to be employed part-time. Question 26 indicated that 115 (38%) of the sample were of Australian nationality while 156 (51%) were of Asian origin. A further 3 (1%) were of British/NZ origin and 28 (9%) other. Question 27 indicated that all respondents had attained a secondary level and were completing a tertiary level of education. This is not surprising given that the majority were full-time tertiary students. Likewise 253 (83%) of the sample indicated their occupation was a full time student in question 28 with 33 (11%) indicating an administrative or accounting position. No doubt this would represent the majority of the 50 post graduate students who were surveyed. The personal income level of 129 (42%) of the sample was zero. A further 10(3%) were under $5,000 while 79 (26%) earned less than $10,000 per annum as indicated in question 29. The employment status of the majority 186 (61%) of participants was also described as full–time students in question 30, while a further 99(31%) indicated that they were employed. This did represent approximately one third of the total sample. Finally, 144 (47%) did not lodged a tax return in the last five years and 138 (45%) did lodge a return for the 2003-04 tax year as indicated in question 31.
The purpose of this study was to examine the relationship between demographic variables and the attitudes of tertiary students towards tax evasion and the penalties for tax evasion and their thoughts regarding tax morals and tax fairness. Specifically objective one of the study was concerned with the attitudes of respondents to various types of individual and business tax evasion. The sum of responses to Q3 indicated there was a fairly normal distribution against the level of education Q27 and in fact for all demographic variables tested Q24-29. That is, the majority of respondents indicated, that regardless of the type of evasion by whatever occupational group, the penalties used by the ATO were about right. (Refer Appendix 3 Bar Charts- Q3 Chart).
The results with respect to objective two the penalties for tax evasion, indicated that for the number of responses to Q4 (a) of the survey, that a monetary fine was the appropriate penalty for tax fraud with respect to the level of education Q 27. While respondents with a secondary level of education the majority indicated that a penalty in the range of $10,000- 15,000 was appropriate, with a definite skew to the right indicating heavier penalties. (Refer Appendix 3- Q4 Top Chart) Respondents with a diploma level of education were more evenly spread throughout penalty levels, while those with tertiary qualifications also indicated that a heavier penalty of $10,000 or more was appropriate. Responses to Q4 (c) of the survey indicated where community service was the appropriate penalty for tax fraud with respect to the level of education Q 27. Of those respondents with a secondary level of education a large majority indicated that a period less than one week of community service was appropriate. Respondents with diploma level education were more evenly spread throughout penalty levels, although a higher proportion indicated less community service while for respondents with tertiary qualifications, a large majority indicated a period of less than one week of community service was appropriate. (Refer Appendix 3 Q4 Bottom Chart).
The respondents’ opinions with regard to Q6, reaction to a substantial fine, indicated a fairly normal distribution against level of education Q27 and in fact for all demographic variables tested Q24-29. Particularly, those with a secondary level of education the majority indicated that they would feel indifferent about having to pay a substantial fine. Respondents with a diploma level of education were more evenly spread throughout penalty levels, while respondents with tertiary qualifications also indicated that they would feel indifferent about having to pay a substantial fine. The responses to Q6 (a) of the survey indicating whether respondents felt that what they had done, was wrong, was also fairly evenly distributed as per the level of education Q 27 (Refer Appendix 3- Q6 Chart). Of those with a secondary level of education a larger majority indicated a rating of likely to very likely as was the case for respondents with tertiary qualifications while respondents with diploma level were more neutral in this regard.
Examining the attitudes of respondents with regard to tax morals and tax fairness was objective 5 of this study. In particular, the responses in relation to Q16 (d) of the survey indicating the opportunities for tradespeople to legally reduce tax were also analysed with respect to the level of education Q 27. (Refer Appendix 3 – Q 16 Top Chart). Findings revealed that for those with a secondary level of education the majority indicated that tradespeople tend to have too few opportunities to legally reduce their tax with a definite skew to the left. Respondents with diploma level education indicated a normal distribution while those with tertiary qualifications indicated that tradespeople have about the right amount of opportunities. The number of responses to Q16 (a) of the survey indicated the opportunities to legally reduce tax for CEOs of large Corporations with respect to the level of education Q 27 (Refer Appendix 3- Q16 Bottom Chart). For respondents with a secondary level of education the majority indicated that corporate CEOs tend to have too many opportunities to legally reduce their tax with a definite skew to the right. Those with diploma level education showed more of a normal distribution but generally felt opportunities were more while those with tertiary qualifications also indicated that CEOs have either the right amount or too many opportunities. Postgraduates were also similar in this regard.
Finally the responses to Q19 (d) of the survey found that the main reason for evading tax was rationality with respect to the level of education Q 27 (Refer Appendix 3- Q19 Top Chart). For those with a secondary level of education the majority indicated that that they would be indifferent or likely to agree with rationality as being a reason for evasion (skew to the right). Respondents with diploma level showed more of a normal distribution while those with tertiary qualifications also indicated that they were neutral or likely to agree with rationality as being a reason for evasion (skew to the right). The responses to Q19(c) of the survey were in relation to the main reason for evading tax as being a game against the ATO with respect to the level of education Q 27 (Refer Appendix 3- Q 19 Bottom Chart). For respondents with a secondary level of education the majority indicated that that they would be indifferent or disagree to strongly disagree with an ATO game as being a reason for evasion (skew to the left). Those with diploma level education were consistent with this pattern while those with tertiary qualifications were also consistent with this pattern and disagreed with the ATO game as being a reason for evasion (skew to the left).
Consequently, it was evident from the findings for questions 24 to 29 and particularly Q27 of the survey that all six demographic variables analysed: gender, age, nationality, education/qualifications, occupation and income level, in many cases held statistically significant relationships with the incidence of tax evasion and the penalties for evasion. These findings are consistent with the findings of previous studies of Birch, Peters and Sawyer,[95] Hite,[96] Meier and Johnson,[97] and Tan.[98] In particular, the research indicates that the level of education which was the predominant variable in this study plays a vital role in respondents’ attitudes towards non-compliant tax behaviour. Likewise age, income level and the occupation of respondents all showed important implications for tax evasion generally, although there was little direct evidence of personal tax evasion amongst respondents.
There are several limitations that exist in this study. Clearly, the study is not representative of the taxpayer population. Despite including a small portion of post-graduate students in the sample, the number of respondents in paid full-time work of varying occupations is non-existent. Likewise, the female population is nearly double that of males, while the age group of 40 years and older is unrepresented. The extent to which the sample was representative of Australian students is unknown. The educational qualifications of the respondents are also, as expected, exaggerated given that 70% of the sample is tertiary educated while personal income levels are too low and not spread across the spectrum. The fact that a random sampling technique was not employed and that the sample was chosen from the student population only, has resulted in various demographics being under represented.
Likewise problems of honesty and misinterpretation in tax surveys are always present and hard to erase. Tax evasion is a sensitive topic and the terminology in the survey instrument may have prevented some respondents from disclosing certain personal information. Despite the findings of Mason and Calvin[99] that taxpayers do admit to previous tax evasion there were only 5 cases or 2% of the sample that admitted to such evasion in this study. This may however, have been as a result of the majority of participants’ lack of work experience which would limit their opportunities to lodge tax returns or even engage in tax evasion. Although the instructions to completing the survey were clearly communicated to the respondents and they were assured of their anonymity, two follow ups were also required to the original survey in order to achieve the final response rate.
The misrepresentation of some questions was also evident in the survey. Question 3 regarding the penalties used by the ATO against various occupational groups did not clearly state what those penalties were and many respondents were unable to comment as a result. Likewise questions 9-11 regarding the response to a personal penalty was confused by some participants who did not realise that the questions followed on from questions 7 and 8.
Nevertheless, it is envisaged that a final version of this pilot survey instrument may be extended to a larger sample of taxpayers more representative of the Australian population. A random sampling technique could be employed and further statistical analysis carried out by way of correlations and regressions. It is also proposed that the behaviours and attitudes of taxpayers could be more accurately ascertained by utilizing this survey instrument in conjunction with other research methodologies such as taxpayer interviews and further experimental or analytical research. As further data is gathered, hopefully the reasons for taxpayers’ responses and attitudinal changes can be more closely explored. This should in turn result in improving the revenue authority’s tax compliance strategies and in particular the employment of its audit resources and enforcement measures in line with its first Tax Compliance Program issued in 2002.[100]
Ajzen, I. and Fishbein, M., Understanding Attitudes and Predicting Social Behaviour, Englewood Cliffs, Prentice Hall, (1980).
Allingham, M. and Sandmo, A., ‘Income Tax Evasion: A Theoretical Analysis’, Journal of Public Economics, Vol 1, (1972): 323-338.
Alm, J. Sanchez, I. and De Juan, A., ‘Economic and Non-Economic Factors in Tax Compliance’, Kyklos, Vol 48, (1995): 3-18.
Birch, A. Peters, T. and Sawyer, A. J., ‘New Zealanders’ Attitudes Towards Tax Evasion: A Demographic Analysis’, New Zealand Journal of Taxation Law and Policy, Vol 9:1 (2003) 65-109.
Carnes, G. A. & Eglebrecht, T, D., ‘An Investigation of the Effect of Detection Risk Perceptions, Penalty Sanctions and Income Visibility on Tax Compliance’, Journal of the American Taxation Association. 17 Spring, (1995): 26-41.
Cialdini, R. B., ‘Social Motivations to Comply: Norms, Values and Principles’, Taxpayer Compliance Social Science Perspective’s, Vol 2, Philadelphia, PA: University of Pennsylvania Press (1989): 200-227.
Dean, P., ‘Taxpayer Attitudes to Income tax Evasion: An Empirical Study’, British Tax Review, Vol 28, (1980): 112-131.
Falkinger, J. & Walther, H., ‘Rewards verus Penalties: on a New Policy on Tax Evasion’, Public Finance Quarterly, 19: (1991): 67-79.
Fischer, C. M., Wartick, M. and Mark, M. M., ‘Detection Probability and Taxpayer Compliance: A Review of the Literature’, Journal of Accounting Literature, Vol 11, (1992): 1-46.
Freiberg, A., ‘Enforcement Discretion and Taxation Offences’, Australian Tax Forum, Vol 3, (1986): 55- 59.
Friedland, N., ‘A Note on Tax Evasion as a Function of the Quality of Information about the Magnitude and Creditability of Threatened Fines: Some Preliminary Research’, Journal of Applied Social Psychology, (1982): 54-59.
Hasseldine, J., ‘Linkages between Compliance Costs and Taxpayer Compliance’, Bulletin for International Fiscal Documentation, 54 (2000),: 299-303.
Hite, P. A., ‘Identifying and Mitigating Taxpayer Non-Compliance’, Australian Tax Forum, Vol 13, (1997) 155-180.
Jackson, B. and Jones, S., ‘Salience of Tax Evasion Penalties versus Detection Risk’, Journal of the American Taxation Association, (Spring) (1985): 7-17.
Jackson, B. R. and Milliron, V. C., ‘Tax Compliance Research: Findings Problems and Prospects’, Journal of Accounting Literature, Vol 5, (1986):125 – 165.
James, S. and Alley, C., ‘Tax Compliance, Self Assessment and Tax Administration in New Zealand- Is the Carrot or Stick More Appropriate to Encourage Compliance?’ New Zealand Journal of Taxation Law and Policy, Vol 5:1 (1999) 3-14.
Kinsey, K. A., Theories and Models of Tax Cheating, (American Bar Foundation Working Paper No 8717, 1988).
Lewis, A., ‘The Psychology of Taxation’, Martin Robertson, Oxford. (1982).
Mc Intosh, R. K. and Veal, .J. A., ‘Tax Evasion and New Zealanders attitudes Towards It’, New Zealand Journal of Taxation Law and Policy, Vol 7, (2001): 80-108.
McKerchar, M., ‘The Impact of Complexity Upon Tax Compliance: A Study of Australian Personal Taxpayers’, Australian Tax Research Foundation, Research Study No 39, (2003).
Meier, R. F., and Johnson W., T., ‘Deterrence as a Social Control: The Legal and Extralegal Production of Conformity,’ American Sociological Review, Vol 42, (1977): 292-304.
Milliron, V. C., and Toy, D. R., ‘Tax Compliance an Investigation of Key Features’, Journal of American Taxation Association, Vol 10, (1988): 84-104.
Pilkington, C., ‘Taxation and Ethical Issues’, in Growthorpe, G. and Blake, J. (eds), Ethical Issues in Accounting, (1998), London, Routledge.
Richardson, M. and Sawyer, A. J., ‘A Taxonomy of the Tax Compliance Literature: Further Findings, Problems and Prospects’, Australian Tax Forum, Vol 16 (2001): 137-320.
Roth, J. and Scholz, J. A., ‘Taxpayer Compliance Volume 1: An Agenda for Research’, Philadelphia: University of Pennsylvania Press (1989).
Schmolders, G., ‘Fiscal Psychology: A New Branch of Public Finance’, National Tax Journal, Vol 12, (1959): 340-345.
Schwartz, R. & Orleans, S., ‘On Legal Sanctions’ University of Chicago Law Review (Winter) (1967): 274-300.
Tan, L. M. and Sawyer, A. J., ‘A Synopsis of Taxpayer Compliance Studies – Overview Vis-à-Vis New Zealand’, New Zealand Journal of Taxation Law and Policy, Vol 9,:4, (2003): 431-454.
Tan L. M., ‘Taxpayers Perceptions of the Fairness of the Tax System – A Preliminary Study’, New Zealand Journal of Taxation Law and Policy, Vol 4, (1998): 59-71.
Tittle, C. and Logan, C., ‘Sanctions and Deviance; Evidence and Remaining Questions’, Law and Society Review (Spring) (1973): 371-389.
Tomasic, R. & Pentony, B., ‘Defining Acceptable Tax Conduct’, Discussion Paper (No 2), Centre for National Corporate Law Research University of Canberra (1990).
Witte, A. D., & Woodbury, D. E., ‘The Effect of Tax Laws and Tax Administration on Tax Compliance’, The Case of the US Individual Income Tax, National Tax Journal, Vol 38, No1, (1985): 1-13.
Wallschutzky, I. G., ‘Possible Causes of Tax Evasion’, Journal of Economic Psychology, (1984), Vol 5, No 4, 371-384
Wallschutzky, I. G., ‘Taxpayer Attitudes to Tax Avoidance and Evasion’, Australian Tax Research Foundation, Research Study No1, (1985).
Walpole, M. and Evans, C., (Eds), Tax Administration in the 21st Century, Prospect, Sydney, 2001.
Worsham, R. G, ‘The Effect of Tax Authority Behaviour on Tax Compliance: A Procedural Justice Approach’, Journal of the American Taxation Association, Vol 18, No 2 Spring, (1996): 19-39.
TAXATION COMPLIANCE SURVEY
Responses to this survey are confidential. Please do not include your name on this survey.
1 How much information about tax issues do you receive from the following sources?
|
|
None
|
|
Some
|
|
A lot
|
|||||||||||
|
|
|
|
|
|
|
|
|
|
||||||||
|
a. the ATO
|
|
|
|
|
|
|
|
|
||||||||
|
|
1
|
2
|
3
|
4
|
5
|
6
|
7
|
|
||||||||
|
|
||||||||||||||||
|
b. tax practitioners
|
|
|
|
|
|
|
|
|
||||||||
|
|
1
|
2
|
3
|
4
|
5
|
6
|
7
|
|
||||||||
|
|
||||||||||||||||
|
c. work-related publications
|
|
|
|
|
|
|
|
|
||||||||
|
|
1
|
2
|
3
|
4
|
5
|
6
|
7
|
|
||||||||
|
|
||||||||||||||||
|
d. TV, radio, newspapers
|
|
|
|
|
|
|
|
|
||||||||
|
|
1
|
2
|
3
|
4
|
5
|
6
|
7
|
|
||||||||
|
|
||||||||||||||||
|
e. friends/family
|
|
|
|
|
|
|
|
|
||||||||
|
|
1
|
2
|
3
|
4
|
5
|
6
|
7
|
|
||||||||
|
|
||||||||||||||||
2. Think about the source which you considered most informative. How much information did you receive on…
|
|
None
|
|
Some
|
|
A lot
|
|||||||||||
|
|
|
|
|
|
|
|
|
|
||||||||
|
a. how to do your tax return
|
|
|
|
|
|
|
|
|
||||||||
|
|
1
|
2
|
3
|
4
|
5
|
6
|
7
|
|
||||||||
|
|
||||||||||||||||
|
b. what will trigger an audit
|
|
|
|
|
|
|
|
|
||||||||
|
|
1
|
2
|
3
|
4
|
5
|
6
|
7
|
|
||||||||
|
|
||||||||||||||||
|
c. what the ATO is able to catch
|
|
|
|
|
|
|
|
|
||||||||
|
|
1
|
2
|
3
|
4
|
5
|
6
|
7
|
|
||||||||
|
|
||||||||||||||||
|
d. what the penalties are for evasion
|
|
|
|
|
|
|
|
|
||||||||
|
|
1
|
2
|
3
|
4
|
5
|
6
|
7
|
|
||||||||
|
|
||||||||||||||||
|
e. people having problems with the ATO
|
|
|
|
|
|
|
|
|
||||||||
|
|
1
|
2
|
3
|
4
|
5
|
6
|
7
|
|
||||||||
|
|
||||||||||||||||
|
f. people outwitting the ATO
|
|
|
|
|
|
|
|
|
||||||||
|
|
1
|
2
|
3
|
4
|
5
|
6
|
7
|
|
||||||||
|
|
|
|
|
|
|
|
|
|
|
|||||||
|
|
|
|
|
|
|
|
|
|
|
|||||||
3 Below is a list of possible cases of tax evasion. What is your impression in each case? How would you describe the penalties used by the ATO against…
|
a. a tradesperson underreporting cash earnings
|
Very
mild
|
|
Right
Amount
|
|
Very
severe
|
|||||||||||
|
|
|
|
|
|
|
|
|
|||||||||
|
|
1
|
2
|
3
|
4
|
5
|
6
|
7
|
|
||||||||
|
|
||||||||||||||||
|
b. an academic exaggerating deduction claims
|
Very
mild
|
|
Right
amount
|
|
Very
severe
|
|||||||||||
|
|
|
|
|
|
|
|
|
|||||||||
|
|
1
|
2
|
3
|
4
|
5
|
6
|
7
|
|
||||||||
|
|
||||||||||||||||
|
c. a small business owner not paying tax debts
|
Very
mild
|
|
Right
amount
|
|
Very
severe
|
|||||||||||
|
|
|
|
|
|
|
|
|
|||||||||
|
|
1
|
2
|
3
|
4
|
5
|
6
|
7
|
|
||||||||
|
|
||||||||||||||||
|
d. a large corporation shifting profits abroad
|
Very
mild
|
|
Right
amount
|
|
Very
severe
|
|||||||||||
|
|
|
|
|
|
|
|
|
|||||||||
|
|
1
|
2
|
3
|
4
|
5
|
6
|
7
|
|
||||||||
|
|
||||||||||||||||
|
e. a welfare recipient under declaring government
payments
|
Very
mild
|
|
Right
amount
|
|
Very
severe
|
|||||||||||
|
|
|
|
|
|
|
|
|
|||||||||
|
|
1
|
2
|
3
|
4
|
5
|
6
|
7
|
|
||||||||
|
|
||||||||||||||||
|
f. a manager underreporting taxes
|
Very
mild
|
|
Right
amount
|
|
Very
severe
|
|||||||||||
|
|
|
|
|
|
|
|
|
|||||||||
|
|
1
|
2
|
3
|
4
|
5
|
6
|
7
|
|
||||||||
|
|
||||||||||||||||
|
g. a student part-time worker failing to lodge a tax
return
|
Very
mild
|
|
Right
amount
|
|
Very
severe
|
|||||||||||
|
|
|
|
|
|
|
|
|
|||||||||
|
|
1
|
2
|
3
|
4
|
5
|
6
|
7
|
|
||||||||
|
|
||||||||||||||||
|
h. a retiree under declaring investment income
|
Very
mild
|
|
Right
amount
|
|
Very
severe
|
|||||||||||
|
|
|
|
|
|
|
|
|
|||||||||
|
|
1
|
2
|
3
|
4
|
5
|
6
|
7
|
|
||||||||
|
|
||||||||||||||||
4. Assume the following case: A buiness owner, (X), negotiated “discounts” for customers in return for being paid in cash. Here, the business owner was able to reduce tax illegally by $10,000. This is the second time the person has been caught and convicted of such an offence.
The ATO would demand that the business owner pays back the tax evaded plus penalties and interest. What would you consider an appropriate penalty for the fraud? (if a combination circle more than one)
|
a. A monetary fine? θ no.
|
|||||||||||||
|
θ yes. If yes, specify the fine in Dollars:
|
|||||||||||||
|
|
|||||||||||||
|
|
|
|
|
|
|
|
|
|
|||||
|
less than $5,000
|
$5,000
|
$10,000
|
$15,000
|
$20,000
|
more than $20,000
|
||||||||
|
|
|||||||||||||
|
b. A prison sentence? θ no.
|
|||||||||||||
|
θ yes. If yes, specify the length of the sentence in months:
|
|||||||||||||
|
|
|||||||||||||
|
|
|
|
|
|
|
|
|
|
|||||
|
less than 1 week
|
1 week
|
2 weeks
|
3 weeks
|
4 weeks
|
more than 4 weeks
|
||||||||
|
|
|||||||||||||
|
c. Community service? θ no.
|
|||||||||||||
|
θ yes. If yes, specify the length of the service in weeks:
|
|||||||||||||
|
|
|||||||||||||
|
|
|
|
|
|
|
|
|
|
|||||
|
less than 1 week
|
1 week
|
2 weeks
|
3 weeks
|
4 weeks
|
more than 4 weeks
|
||||||||
|
|
|||||||||||||
|
|
|||||||||||||
|
d. Education program? θ no.
|
|||||||||||||
|
θ yes. If yes, specify the length of the program in days:
|
|||||||||||||
|
|
|||||||||||||
|
|
|
|
|
|
|
|
|
|
|||||
|
less than 3 days
|
3 days
|
6 days
|
9 days
|
12 days
|
more than 12 days
|
||||||||
|
|
|||||||||||||
5. Assume the business owner (X) above had to pay a substantial fine or penalty, please answer the following questions.
|
a. Do you think X deserves the harsh punishment?
|
Not at all
|
|
Neutral
|
|
Very much
|
|||||||||||
|
|
|
|
|
|
|
|
|
|||||||||
|
|
|
|
|
|
|
|
|
|||||||||
|
|
1
|
2
|
3
|
4
|
5
|
6
|
7
|
|
||||||||
|
|
||||||||||||||||
|
b. Do you think X was personally responsible for receiving the
penalty?
|
Not at all
|
|
Neutral
|
|
Very much
|
|||||||||||
|
|
|
|
|
|
|
|
|
|||||||||
|
|
1
|
2
|
3
|
4
|
5
|
6
|
7
|
|
||||||||
|
|
||||||||||||||||
|
c. Do you think X knew the probable consequences of his/her evasion?
|
Not at all
|
|
Neutral
|
|
Very much
|
|||||||||||
|
|
|
|
|
|
|
|
|
|||||||||
|
|
1
|
2
|
3
|
4
|
5
|
6
|
7
|
|
||||||||
|
|
||||||||||||||||
|
d. Do you think X was justified in reducing tax?
|
Not at all
|
|
Neutral
|
|
Very much
|
|||||||||||
|
|
|
|
|
|
|
|
|
|||||||||
|
|
1
|
2
|
3
|
4
|
5
|
6
|
7
|
|
||||||||
|
|
||||||||||||||||
|
e. Do you think X’s tax evasion is a serious offence?
|
Not at all
|
|
Neutral
|
|
Very much
|
|||||||||||
|
|
|
|
|
|
|
|
|
|||||||||
|
|
1
|
2
|
3
|
4
|
5
|
6
|
7
|
|
||||||||
6. Now please assume you are the business owner and you had to pay a substantial fine or penalty. How likely is it that you would…
|
|
Not likely
|
|
Neutral
|
|
Very likely
|
|||||||||||
|
|
|
|
|
|
|
|
|
|
||||||||
|
a. feel that what you had done was wrong
|
|
|
|
|
|
|
|
|
||||||||
|
|
1
|
2
|
3
|
4
|
5
|
6
|
7
|
|
||||||||
|
|
|
|
|
|
|
|
|
|
|
|||||||
|
|
|
|
|
|
|
|
|
|
|
|||||||
|
b. feel sorry/remorseful
|
|
|
|
|
|
|
|
|
||||||||
|
|
1
|
2
|
3
|
4
|
5
|
6
|
7
|
|
||||||||
|
|
||||||||||||||||
|
c Ignore the penalty and take the risk
|
|
|
|
|
|
|
|
|
||||||||
|
|
1
|
2
|
3
|
4
|
5
|
6
|
7
|
|
||||||||
|
|
||||||||||||||||
|
d. feel like you had won if you got away without paying the
fine
|
|
|
|
|
|
|
|
|
||||||||
|
|
1
|
2
|
3
|
4
|
5
|
6
|
7
|
|
||||||||
|
e. resent the ATO having control over you
|
|
|
|
|
|
|
|
|
||||||||
|
|
1
|
2
|
3
|
4
|
5
|
6
|
7
|
|
||||||||
|
|
|
|
|
|
|
|
|
|
|
|||||||
|
|
|
|
|
|
|
|
|
|
|
|||||||
7 Have you ever been fined or penalised in some way by the ATO?
Yes 1 --- continue
No 2 --skip toQ 12
8 If yes, for what type of offence? (i.e. Civil, criminal) For example
Making a false or misleading statement…………………………………………………… 1
Obtaining a financial advantage by deceiving the Commonwealth or Public Authority……2
Defrauding the Commonwealth……………………………………………………………..3
Failure to withhold and remit tax……………………………………………………………4
Other……………………………………………………………………………………… .5
9. If you stated yes to 7, do you think the ATO’s decision to penalise you was…
|
Absolutely unfair
|
|
Indifferent
|
|
Absolutely fair
|
|||||||||||
|
|
|
|
|
|
|
|
|
|
|
|
|
|
|
|
|
|
|
1
|
2
|
3
|
4
|
5
|
6
|
7
|
|
|||||||
10. Do you think the penalties against you were…
|
Very mild
|
|
About right
|
|
Very severe
|
|||||||||||
|
|
|
|
|
|
|
|
|
|
|
|
|
|
|
|
|
|
|
1
|
2
|
3
|
4
|
5
|
6
|
7
|
|
|||||||
11. Were the reasons for the penalty clear or unclear to you?
|
Totally clear
|
|
Neutral
|
|
Totally unclear
|
|||||||||||
|
|
|
|
|
|
|
|
|
|
|
|
|
|
|
|
|
|
|
1
|
2
|
3
|
4
|
5
|
6
|
7
|
|
|||||||
12. In the following, there are some more general positions concerning the issue of law enforcement. Please indicate to what extent you disagree or agree with these views.
Scale:1 = Strongly disagree 2. = Mildly disagree 3. = Disagree 4. = Neither agree or disagree 5. = Agree 6. = Mildly agree 7. = Strongly agree
|
a. The prospect of tough penalties would deter people from
evading tax
|
Strongly disagree
|
|
Neither agree or disagree
|
|
Strongly agree
|
|||||||||||
|
|
|
|
|
|
|
|
|
|||||||||
|
|
1
|
2
|
3
|
4
|
5
|
6
|
7
|
|
||||||||
|
|
||||||||||||||||
|
b. Teaching tax evaders to deal effectively with their taxes
would reduce future offences
|
Strongly disagree
|
|
|
|
Strongly agree
|
|||||||||||
|
|
|
|
|
|
|
|
|
|||||||||
|
|
1
|
2
|
3
|
4
|
5
|
6
|
7
|
|
||||||||
|
|
||||||||||||||||
13. How do you think tax evasion could be best handled?
|
a. Through informing and encouraging taxpayers to comply
voluntarily
|
Strongly disagree
|
|
|
|
Strongly agree
|
|||||||||||
|
|
|
|
|
|
|
|
|
|||||||||
|
|
1
|
2
|
3
|
4
|
5
|
6
|
7
|
|
||||||||
|
|
||||||||||||||||
|
b. Through enforcing strict rules and disciplining the
guilty.
|
Strongly disagree
|
|
|
|
Strongly agree
|
|||||||||||
|
|
|
|
|
|
|
|
|
|||||||||
|
|
1
|
2
|
3
|
4
|
5
|
6
|
7
|
|
||||||||
|
|
||||||||||||||||
|
c. Through exposing people who cheat the tax system (eg,
publishing names of tax evaders in the ATO annual report)
|
Strongly disagree
|
|
|
|
Strongly agree
|
|||||||||||
|
|
|
|
|
|
|
|
|
|||||||||
|
|
1
|
2
|
3
|
4
|
5
|
6
|
7
|
|
||||||||
|
|
||||||||||||||||
|
d. Through providing incentives for paying the correct amount of
tax
|
Strongly disagree
|
|
|
|
Strongly agree
|
|||||||||||
|
|
|
|
|
|
|
|
|
|||||||||
|
|
1
|
2
|
3
|
4
|
5
|
6
|
7
|
|
||||||||
|
|
||||||||||||||||
14. The following statements are possible opinions about the tax system and the ATO. Indicate how much you disagree or agree with the statement.
|
a. The ATO can be trusted to administer the tax system so that
it is good for the country as whole.
|
Strongly disagree
|
|
Neither agree or disagree
|
|
Strongly agree
|
|||||||||||
|
|
|
|
|
|
|
|
|
|||||||||
|
|
1
|
2
|
3
|
4
|
5
|
6
|
7
|
|
||||||||
|
|
||||||||||||||||
|
b. The ATO tries to be fair when making their decisions
|
Strongly disagree
|
|
|
|
Strongly agree
|
|||||||||||
|
|
|
|
|
|
|
|
|
|||||||||
|
|
1
|
2
|
3
|
4
|
5
|
6
|
7
|
|
||||||||
|
|
||||||||||||||||
|
c. People should follow the decisions of the ATO even if they go
against what they think is right
|
Strongly disagree
|
|
|
|
Strongly agree
|
|||||||||||
|
|
|
|
|
|
|
|
|
|||||||||
|
|
1
|
2
|
3
|
4
|
5
|
6
|
7
|
|
||||||||
|
|
||||||||||||||||
|
d. The ATO effectively upholds the principles of equal rights
and opportunities
|
Strongly disagree
|
|
|
|
Strongly agree
|
|||||||||||
|
|
|
|
|
|
|
|
|
|||||||||
|
|
1
|
2
|
3
|
4
|
5
|
6
|
7
|
|
||||||||
|
|
||||||||||||||||
|
15 Personally, how many opportunities do you have to legally
reduce your tax?
|
Too
few
|
|
Right
amount
|
|
Too
many
|
|||||||||||
|
|
|
|
|
|
|
|
|
|||||||||
|
|
1
|
2
|
3
|
4
|
5
|
6
|
7
|
|
||||||||
|
|
||||||||||||||||
16. In your opinion, do the following groups have many opportunities to legally reduce their tax?
|
a. Chief executives of large corporations
|
Too
few
|
|
Right
amount
|
|
Too
many
|
|||||||||||
|
|
|
|
|
|
|
|
|
|||||||||
|
|
1
|
2
|
3
|
4
|
5
|
6
|
7
|
|
||||||||
|
|
||||||||||||||||
|
b. Judges and barristers
|
Too
few
|
|
Right
amount
|
|
Too
many
|
|||||||||||
|
|
|
|
|
|
|
|
|
|||||||||
|
|
1
|
2
|
3
|
4
|
5
|
6
|
7
|
|
||||||||
|
|
||||||||||||||||
|
c. Unskilled factory workers
|
Too
few
|
|
Right
amount
|
|
Too
many
|
|||||||||||
|
|
|
|
|
|
|
|
|
|||||||||
|
|
1
|
2
|
3
|
4
|
5
|
6
|
7
|
|
||||||||
|
|
||||||||||||||||
|
d. Trades people
|
Too
few
|
|
Right
amount
|
|
Too
many
|
|||||||||||
|
|
|
|
|
|
|
|
|
|||||||||
|
|
1
|
2
|
3
|
4
|
5
|
6
|
7
|
|
||||||||
|
|
||||||||||||||||
|
e. Clerical workers
|
Too
few
|
|
Right
amount
|
|
Too
many
|
|||||||||||
|
|
|
|
|
|
|
|
|
|||||||||
|
|
1
|
2
|
3
|
4
|
5
|
6
|
7
|
|
||||||||
|
f. Small business owners
|
Too
few
|
|
Right
amount
|
|
Too
many
|
|||||||||||
|
|
|
|
|
|
|
|
|
|||||||||
|
|
1
|
2
|
3
|
4
|
5
|
6
|
7
|
|
||||||||
|
|
||||||||||||||||
Please be completely honest in your responses to these questions. Remember all your responses are totally anonymous.
17. What is important to you?
|
|
Not at all
|
|
Neutral
|
|
Very much
|
|||||||||||
|
|
|
|
|
|
|
|
|
|
||||||||
|
a. your individuality
|
|
|
|
|
|
|
|
|
||||||||
|
|
1
|
2
|
3
|
4
|
5
|
6
|
7
|
|
||||||||
|
|
||||||||||||||||
|
b. your profession/industry
|
|
|
|
|
|
|
|
|
||||||||
|
|
1
|
2
|
3
|
4
|
5
|
6
|
7
|
|
||||||||
|
|
||||||||||||||||
|
|
||||||||||||||||
|
c. the Australian community
|
|
|
|
|
|
|
|
|
||||||||
|
|
1
|
2
|
3
|
4
|
5
|
6
|
7
|
|
||||||||
|
|
||||||||||||||||
|
d. being an honest taxpayer
|
|
|
|
|
|
|
|
|
||||||||
|
|
1
|
2
|
3
|
4
|
5
|
6
|
7
|
|
||||||||
18. These questions ask you what YOU think.
|
a. Do YOU think one should honestly declare all income on one’s
tax return?
|
Not at all
|
|
Neutral
|
|
Very much
|
|||||||||||
|
|
|
|
|
|
|
|
|
|||||||||
|
|
1
|
2
|
3
|
4
|
5
|
6
|
7
|
|
||||||||
|
|
||||||||||||||||
|
b. Do YOU think it is acceptable to overstate tax deductions on
one’s tax return?
|
Not at all
|
|
|
|
Very much
|
|||||||||||
|
|
|
|
|
|
|
|
|
|||||||||
|
|
1
|
2
|
3
|
4
|
5
|
6
|
7
|
|
||||||||
|
|
||||||||||||||||
|
c. Do YOU think working for cash-in-hand payments without paying tax
is a trivial offence?
|
Not at all
|
|
|
|
Very much
|
|||||||||||
|
|
|
|
|
|
|
|
|
|||||||||
|
|
1
|
2
|
3
|
4
|
5
|
6
|
7
|
|
||||||||
|
|
||||||||||||||||
19. People who evade tax probably do so for different reasons. If you ever evaded tax, what would be your main reason for doing so?
|
a. I would want to compensate myself for being unfairly
disadvantaged by the tax system
|
Strongly disagree
|
|
Neutral
|
|
Strongly agree
|
|||||||||||
|
|
|
|
|
|
|
|
|
|||||||||
|
|
1
|
2
|
3
|
4
|
5
|
6
|
7
|
|
||||||||
|
|
||||||||||||||||
|
b. I would look after my own interests first, as everybody else
does
|
Strongly disagree
|
|
Neutral
|
|
Strongly agree
|
|||||||||||
|
|
|
|
|
|
|
|
|
|||||||||
|
|
1
|
2
|
3
|
4
|
5
|
6
|
7
|
|
||||||||
|
|
||||||||||||||||
|
c. I would see it as a game against the ATO and thought I would get
away with it
|
Strongly disagree
|
|
Neutral
|
|
Strongly agree
|
|||||||||||
|
|
|
|
|
|
|
|
|
|||||||||
|
|
1
|
2
|
3
|
4
|
5
|
6
|
7
|
|
||||||||
|
|
||||||||||||||||
|
d. I would find it rational to try and get the most out of any
situation
|
Strongly disagree
|
|
Neutral
|
|
Strongly agree
|
|||||||||||
|
|
|
|
|
|
|
|
|
|||||||||
|
|
1
|
2
|
3
|
4
|
5
|
6
|
7
|
|
||||||||
|
|
||||||||||||||||
|
e. I would have had a bad experience with the ATO and would want
to get even
|
Strongly disagree
|
|
Neutral
|
|
Strongly agree
|
|||||||||||
|
|
|
|
|
|
|
|
|
|||||||||
|
|
1
|
2
|
3
|
4
|
5
|
6
|
7
|
|
||||||||
|
|
||||||||||||||||
20. Did you rely on a tax agent or advisor (tax accountant or lawyer) in preparing your most recent income tax return?
Yes…………………………………………..1--continue
No ………………………………………2 --- skip to 22
21 What would be your primary reason for using a tax agent?
Fear of making a mistake 1
The tax system is too complex 2
Insufficient time to prepare my own return 3
To legitimately minimise the tax I had to pay 4
To avoid paying tax 5
22. Assuming you use a tax agent, you find he or she is unsure about whether one of your expenses is deductible on your tax return, as the tax law relating to this expense is ambiguous. Your tax agent tells you that if you claim the deduction there is a low probability that your tax return will be audited, and that if you are audited, the taxpayer penalty would be mild. After thinking about the situation, your agent advises you NOT TO CLAIM the deduction on your return.
a. Would you agree with the advice your tax agent has given you?
|
|
Definitely Yes
|
Probably Yes
|
Neutral
|
Probably No
|
Definitely No
|
|
||||||
|
|
|
|
|
|
|
|
|
|
|
|
|
|
|
|
1
|
2
|
3
|
4
|
5
|
|
||||||
b. Based on your tax agent’s advice NOT TO CLAIM the ambiguous deduction, would you continue to use this agent?
|
|
Definitely Yes
|
Probably Yes
|
Neutral
|
Probably No
|
Definitely No
|
|
||||||
|
|
|
|
|
|
|
|
|
|
|
|
|
|
|
|
1
|
2
|
3
|
4
|
5
|
|
||||||
23. Think again of the scenario presented above. Now assume that your tax agent advises you to CLAIM the ambiguous deduction on your return.
a. Would you agree with the advice your tax agent has given you?
|
|
Definitely Yes
|
Probably Yes
|
Neutral
|
Probably No
|
Definitely No
|
|
||||||
|
|
|
|
|
|
|
|
|
|
|
|
|
|
|
|
1
|
2
|
3
|
4
|
5
|
|
||||||
b. Based on your tax agent’s advice to CLAIM the ambiguous deduction, would you continue to use this agent?
|
|
Definitely Yes
|
Probably Yes
|
Neutral
|
Probably No
|
Definitely No
|
|
||||||
|
|
|
|
|
|
|
|
|
|
|
|
|
|
|
|
1
|
2
|
3
|
4
|
5
|
|
||||||
This section asks questions about you. These characteristics are very important to our research on how different people in different circumstances feel about tax issues.
24. What is your gender?
Male 1
Female 2
25. What is your age in years? ___________ years
26. What is your nationality?
27. What was the highest level of education you completed?
Did not have any or much formal schooling 1
Primary School 2
Junior/ Intermediate/ Form 4/ Year 10 3
Secondary/ Leaving/ Form 6/ Year 12 4
Trade certificate/Nursing Diploma 5
Diploma Course 6
University/Tertiary Degree 7
Post-graduate Degree 8
28. What is your current occupation? …………………………………………………………….
29. And your own personal income – about how many thousand dollars? (Please circle a number)
|
|
|
|
|
|
|
|
|
|
|
|
|
|
|
|
|
|
|
|
|||||||||||||
|
|
|
|
|
|
|
|
|
|
|
|
|
|
|
|
|
|
|
|
|
|
|
|
|
|
|
|
|
|
|
|
|
None |
10
|
20
|
30
|
40
|
50
|
60
|
70
|
80
|
90
|
100
|
110
|
120
|
130
|
140+
|
|||||||||||||||||
30. If you are currently not working are you
Unemployed……………………………… ……1
Retired from paid work…………………………..2
Full-time student…………………………………3
Keeping house……………………………………4
Other.......................................................................5
31. When was your last income tax return lodged or lodged on your behalf. What financial year was it for?
2003/2004 Financial year………………………………….. 1
2002/2003 Financial Year 2
2001/2002 Financial Year 3
2000/2001 Financial Year 4
Have not lodged a tax return in the last 5 years 5 --
THANK YOU VERY MUCH FOR FILLING OUT THE QUESTIONNAIRE!!
We know that it was a long questionnaire and that there have been some hard questions, but they were important and we really appreciate your dedication in seeing it through to the end.
Please put it in the return envelope and mail it back to us at Monash University. Your co-operation has been a great help. Thanks again!
If you have any comments which you would like to add, please write them below.
• * Statistically Significant at p< or =0.05
• **Marginally Significant where 0.05 < p< 0.15
• *** Insignificant at p>0.15
Question 3 Impression of penalties used by the ATO in cases of Tax Evasion
Q3 (a) Tradesperson underreporting
|
Demographic –Independent variable
|
Chi-Square
|
df
|
Significance
|
|
1. Gender
|
14.515
|
12
|
0.269***
|
|
2.Age
|
150.270
|
120
|
0.032*
|
|
3.Nationality
|
201.818
|
186
|
0.203***
|
|
4.Education
|
15.255
|
18
|
0.644
|
|
5.Occupation
|
173.286
|
180
|
0.627
|
|
6.Income level
|
62.291
|
60
|
0.395
|
|
7.If not employed
|
|
|
|
|
8. Filing Experience
|
|
|
|
Q3 (b) Academic exaggerating deduction claims
|
Demographic –Independent variable
|
Chi-Square
|
df
|
Significance
|
|
1. Gender
|
4.242
|
12
|
0.979***
|
|
2.Age
|
131.503
|
120
|
0.223
|
|
3.Nationality
|
160.328
|
186
|
0.914
|
|
4.Education
|
13.034
|
18
|
0.790
|
|
5.Occupation
|
129.394
|
180
|
0.998
|
|
6.Income level
|
25.829
|
60
|
1.000***
|
|
7.If not employed
|
|
|
|
|
8. Filing Experience
|
|
|
|
Q3 (c) small business owner not paying tax debts
|
Demographic –Independent variable
|
Chi-Square
|
df
|
Significance
|
|
1. Gender
|
9.077
|
12
|
0.696
|
|
2.Age
|
129.764
|
120
|
0.256
|
|
3.Nationality
|
168.466
|
186
|
0.817
|
|
4.Education
|
31.412
|
18
|
0.026*
|
|
5.Occupation
|
158.009
|
180
|
0.880
|
|
6.Income level
|
71.936
|
60
|
0.139**
|
|
7.If not employed
|
|
|
|
|
8. Filing Experience
|
|
|
|
Q3 (d) a large corporation shifting profits abroad.
|
Demographic –Independent variable
|
Chi-Square
|
df
|
Significance
|
|
1. Gender
|
6.840
|
12
|
0.868
|
|
2.Age
|
101.462
|
114
|
0.793
|
|
3.Nationality
|
158.841
|
180
|
0.870
|
|
4.Education
|
13.428
|
18
|
0.766
|
|
5.Occupation
|
190.639
|
180
|
0.279
|
|
6.Income level
|
54.185
|
60
|
0.687
|
|
7.If not employed
|
|
|
|
|
8. Filing Experience
|
|
|
|
|
|
|
|
|
Q3 (e) welfare recipient under declaring govt payments
|
Demographic –Independent variable
|
Chi-Square
|
df
|
Significance
|
|
1. Gender
|
12.228
|
12
|
0.428
|
|
2.Age
|
129.809
|
114
|
0.148**
|
|
3.Nationality
|
158.859
|
180
|
0.870
|
|
4.Education
|
18.893
|
18
|
0.398
|
|
5.Occupation
|
212.607
|
180
|
0.049*
|
|
6.Income level
|
68.279
|
60
|
0.217
|
|
7.If not employed
|
|
|
|
|
8. Filing Experience
|
|
|
|
Q3 (f) a manager under reporting taxes
|
Demographic –Independent variable
|
Chi-Square
|
df
|
Significance
|
|
1. Gender
|
17.336
|
12
|
0.137**
|
|
2.Age
|
126.913
|
114
|
0.193
|
|
3.Nationality
|
165.295
|
180
|
0.777
|
|
4.Education
|
33.036
|
18
|
0.017*
|
|
5.Occupation
|
170.248
|
180
|
0.687
|
|
6.Income level
|
55.727
|
60
|
0.632
|
|
7.If not employed
|
|
|
|
|
8. Filing Experience
|
|
|
|
Q3 (g) student/part-time worker failing to lodge
|
Demographic –Independent variable
|
Chi-Square
|
df
|
Significance
|
|
1. Gender
|
9.475
|
12
|
0.662
|
|
2.Age
|
107.779
|
114
|
0.646
|
|
3.Nationality
|
167.901
|
180
|
0.731
|
|
4.Education
|
17.489
|
18
|
0.490
|
|
5.Occupation
|
166.750
|
180
|
0.752
|
|
6.Income level
|
54.247
|
60
|
0.685
|
|
7.If not employed
|
|
|
|
|
8. Filing Experience
|
|
|
|
Q3 (h) a retiree under declaring investment income
|
Demographic –Independent variable
|
Chi-Square
|
df
|
Significance
|
|
1. Gender
|
13.237
|
12
|
0.352
|
|
2.Age
|
100.369
|
120
|
0.903
|
|
3.Nationality
|
171.931
|
186
|
0.762
|
|
4.Education
|
14.672
|
18
|
0.684
|
|
5.Occupation
|
182.887
|
180
|
0.426
|
|
6.Income level
|
49.993
|
60
|
0.818
|
|
7.If not employed
|
|
|
|
|
8. Filing Experience
|
|
|
|
Question 4 Appropriate Penalty for a Hypothetical case of tax Fraud
Q4 (a) Monetary Fine
|
Demographic –Independent variable
|
Chi-Square
|
df
|
Significance
|
|
1. Gender
|
129.449
|
120
|
0.261
|
|
2.Age
|
181.725
|
180
|
0.450
|
|
3.Nationality
|
23.731
|
18
|
0.164
|
|
4.Education
|
158.347
|
174
|
0.797
|
|
5.Occupation
|
62.624
|
60
|
0.383
|
|
6.Income level
|
19.787
|
12
|
0.071**
|
|
7.If not employed
|
|
|
|
|
8. Filing Experience
|
|
|
|
Q4 (b) Prison Sentence
|
Demographic –Independent variable
|
Chi-Square
|
df
|
Significance
|
|
1. Gender
|
19.787
|
12
|
0.071**
|
|
2.Age
|
129.878
|
114
|
0.147**
|
|
3.Nationality
|
129.881
|
180
|
0.998
|
|
4.Education
|
24.817
|
18
|
0.130**
|
|
5.Occupation
|
77.894
|
180
|
1.000***
|
|
6.Income level
|
50.524
|
60
|
0.803
|
|
7.If not employed
|
|
|
|
|
8. Filing Experience
|
|
|
|
Q4 (c) Community Service
|
Demographic –Independent variable
|
Chi-Square
|
df
|
Significance
|
|
1. Gender
|
7.898
|
12
|
0.793
|
|
2.Age
|
79.881
|
114
|
0.994
|
|
3.Nationality
|
136.803
|
180
|
0.993
|
|
4.Education
|
8.857
|
18
|
0.963
|
|
5.Occupation
|
153.301
|
180
|
0.926
|
|
6.Income level
|
43.623
|
60
|
0.945
|
|
7.If not employed
|
|
|
|
|
8. Filing Experience
|
|
|
|
Q4 (d) Educational Program
|
Demographic –Independent variable
|
Chi-Square
|
df
|
Significance
|
|
1. Gender
|
14.989
|
12
|
0.242
|
|
2.Age
|
131.275
|
114
|
0.128**
|
|
3.Nationality
|
173.804
|
180
|
0.616
|
|
4.Education
|
13.490
|
18
|
0.762
|
|
5.Occupation
|
224.744
|
180
|
0.013*
|
|
6.Income level
|
44.003
|
60
|
0.940
|
|
7.If not employed
|
|
|
|
|
8. Filing Experience
|
|
|
|
Question 6 Respondents reactions to a substantial penalty
Q6 (a) Wrong doing
|
Demographic –Independent variable
|
Chi-Square
|
df
|
Significance
|
|
1. Gender
|
13.411
|
12
|
0.340
|
|
2.Age
|
110.880
|
120
|
0.713
|
|
3.Nationality
|
198.662
|
186
|
0.249
|
|
4.Education
|
15.982
|
18
|
0.594
|
|
5.Occupation
|
188.204
|
180
|
0.322
|
|
6.Income level
|
65.655
|
60
|
0.287
|
|
7.If not employed
|
|
|
|
|
8. Filing Experience
|
|
|
|
Q6 (b) Feel sorry/remorseful
|
Demographic –Independent variable
|
Chi-Square
|
df
|
Significance
|
|
1. Gender
|
28.476
|
12
|
0.005*
|
|
2.Age
|
140.677
|
120
|
0.096**
|
|
3.Nationality
|
217.078
|
186
|
0.059**
|
|
4.Education
|
19.286
|
18
|
0.374
|
|
5.Occupation
|
177.680
|
180
|
0.535
|
|
6.Income level
|
68.057
|
60
|
0.222
|
|
7.If not employed
|
|
|
|
|
8. Filing Experience
|
|
|
|
Q6 (c) Ignore penalty and take risk
|
Demographic –Independent variable
|
Chi-Square
|
df
|
Significance
|
|
1. Gender
|
23.538
|
12
|
0.023*
|
|
2.Age
|
104.797
|
114
|
0.720
|
|
3.Nationality
|
194.495
|
186
|
0.320
|
|
4.Education
|
27.281
|
18
|
0.074**
|
|
5.Occupation
|
173.192
|
180
|
0.629
|
|
6.Income level
|
79.119
|
60
|
0.050*
|
|
7.If not employed
|
|
|
|
|
8. Filing Experience
|
|
|
|
Q6 (d) Feeling of getting away with it
|
Demographic –Independent variable
|
Chi-Square
|
df
|
Significance
|
|
1. Gender
|
25.472
|
12
|
0.013*
|
|
2.Age
|
127.665
|
120
|
0.299
|
|
3.Nationality
|
201.410
|
180
|
0.131**
|
|
4.Education
|
24.298
|
18
|
0.127**
|
|
5.Occupation
|
181.312
|
180
|
0.459
|
|
6.Income level
|
65.646
|
60
|
0.288
|
|
7.If not employed
|
|
|
|
|
8. Filing Experience
|
|
|
|
Q6 (e) Resent ATO control
|
Demographic –Independent variable
|
Chi-Square
|
df
|
Significance
|
|
1. Gender
|
13.458
|
12
|
0.337
|
|
2.Age
|
120.944
|
120
|
0.459
|
|
3.Nationality
|
246.159
|
186
|
0.002*
|
|
4.Education
|
24.563
|
18
|
0.137**
|
|
5.Occupation
|
199.989
|
180
|
0.146**
|
|
6.Income level
|
63.650
|
60
|
0.349
|
|
7.If not employed
|
|
|
|
|
8. Filing Experience
|
|
|
|
Question 16 Which groups have the opportunity to legally reduce their tax?
Q16 (a) Corporate CEO’s
|
Demographic –Independent variable
|
Chi-Square
|
Df
|
Significance
|
|
1. Gender
|
25.592
|
12
|
0.012*
|
|
2.Age
|
115.663
|
120
|
0.595
|
|
3.Nationality
|
165.763
|
186
|
0.854
|
|
4.Education
|
16.707
|
18
|
0.543
|
|
5.Occupation
|
162.784
|
174
|
0.719
|
|
6.Income level
|
63.551
|
60
|
0.352
|
|
7.If not employed
|
|
|
|
|
8. Filing Experience
|
|
|
|
Q16 (b) Judges and barristers
|
Demographic –Independent variable
|
Chi-Square
|
df
|
Significance
|
|
1. Gender
|
15.514
|
12
|
0.215
|
|
2.Age
|
135.783
|
120
|
0.154
|
|
3.Nationality
|
218.982
|
186
|
0.049*
|
|
4.Education
|
9.219
|
18
|
0.954
|
|
5.Occupation
|
144.018
|
174
|
0.953
|
|
6.Income level
|
71.351
|
60
|
0.150**
|
|
7.If not employed
|
|
|
|
|
8. Filing Experience
|
|
|
|
Q16 (c) Unskilled factory workers
|
Demographic –Independent variable
|
Chi-Square
|
df
|
Significance
|
|
1. Gender
|
9.387
|
12
|
0.670
|
|
2.Age
|
121.929
|
120
|
0.434
|
|
3.Nationality
|
193.858
|
186
|
0.331
|
|
4.Education
|
25.368
|
18
|
0.115**
|
|
5.Occupation
|
179.191
|
180
|
0.503
|
|
6.Income level
|
67.145
|
60
|
0.246
|
|
7.If not employed
|
|
|
|
|
8. Filing Experience
|
|
|
|
Q16 (d) Trades People
|
Demographic –Independent variable
|
Chi-Square
|
df
|
Significance
|
|
1. Gender
|
9.574
|
12
|
0.653
|
|
2.Age
|
152.967
|
120
|
0.023*
|
|
3.Nationality
|
213.502
|
186
|
0.081**
|
|
4.Education
|
24.993
|
18
|
0.125**
|
|
5.Occupation
|
143.907
|
180
|
0.978
|
|
6.Income level
|
71.302
|
60
|
0.151**
|
|
7.If not employed
|
|
|
|
|
8. Filing Experience
|
|
|
|
Q16 (e) Clerical workers
|
Demographic –Independent variable
|
Chi-Square
|
df
|
Significance
|
|
1. Gender
|
6.018
|
12
|
0.915
|
|
2.Age
|
96.881
|
120
|
0.940
|
|
3.Nationality
|
124.928
|
186
|
1.000***
|
|
4.Education
|
20.174
|
18
|
0.323
|
|
5.Occupation
|
97.818
|
180
|
1.000***
|
|
6.Income level
|
59.633
|
60
|
0.489
|
|
7.If not employed
|
|
|
|
|
8. Filing Experience
|
|
|
|
Q16 (f) Small Business Owners
|
Demographic –Independent variable
|
Chi-Square
|
df
|
Significance
|
|
1. Gender
|
7.870
|
12
|
0.795
|
|
2.Age
|
143.160
|
120
|
0.073**
|
|
3.Nationality
|
172.178
|
186
|
0.758
|
|
4.Education
|
12.132
|
18
|
0.840
|
|
5.Occupation
|
174.290
|
180
|
0.606
|
|
6.Income level
|
50.705
|
60
|
0.798
|
|
7.If not employed
|
|
|
|
|
8. Filing Experience
|
|
|
|
Question 19 – Main Reasons For Evading Tax
Q19(a) Compensation
|
Demographic –Independent variable
|
Chi-Square
|
df
|
Significance
|
|
1. Gender
|
18.336
|
12
|
0.106**
|
|
2.Age
|
147.371
|
114
|
0.019*
|
|
3.Nationality
|
213.931
|
180
|
0.043*
|
|
4.Education
|
28.884
|
18
|
0.050*
|
|
5.Occupation
|
183.038
|
180
|
0.423
|
|
6.Income level
|
68.098
|
60
|
0.221
|
|
7.If not employed
|
|
|
|
|
8. Filing Experience
|
|
|
|
Q19 (b) Self Interest
|
Demographic –Independent variable
|
Chi-Square
|
df
|
Significance
|
|
1. Gender
|
14.649
|
12
|
0.261
|
|
2.Age
|
130.476
|
114
|
0.675
|
|
3.Nationality
|
205.004
|
180
|
0.097**
|
|
4.Education
|
16.726
|
18
|
0.542
|
|
5.Occupation
|
135.519
|
180
|
0.994
|
|
6.Income level
|
58.765
|
60
|
0.521
|
|
7.If not employed
|
|
|
|
|
8. Filing Experience
|
|
|
|
Q19(c) ATO Game
|
Demographic –Independent variable
|
Chi-Square
|
df
|
Significance
|
|
1. Gender
|
20.502
|
12
|
0.058*
|
|
2.Age
|
101.135
|
114
|
0.800
|
|
3.Nationality
|
185.078
|
180
|
0.382
|
|
4.Education
|
35.185
|
18
|
0.009*
|
|
5.Occupation
|
177.05
|
180
|
0.548
|
|
6.Income level
|
76.369
|
60
|
0.075**
|
|
7.If not employed
|
|
|
|
|
8. Filing Experience
|
|
|
|
Q19 (d) Rational
|
Demographic –Independent variable
|
Chi-Square
|
df
|
Significance
|
|
1. Gender
|
21.056
|
12
|
0.050*
|
|
2.Age
|
136.673
|
114
|
0.073**
|
|
3.Nationality
|
217.582
|
180
|
0.029*
|
|
4.Education
|
23.009
|
18
|
0.190
|
|
5.Occupation
|
174.212
|
180
|
0.608
|
|
6.Income level
|
68.126
|
60
|
0.220
|
|
7.If not employed
|
|
|
|
|
8. Filing Experience
|
|
|
|
Q19 (e) Getting even with the ATO
|
Demographic –Independent variable
|
Chi-Square
|
df
|
Significance
|
|
1. Gender
|
26.044
|
12
|
0.011*
|
|
2.Age
|
107.989
|
114
|
0.641
|
|
3.Nationality
|
167.258
|
180
|
0.743
|
|
4.Education
|
24.532
|
18
|
0.138**
|
|
5.Occupation
|
152.705
|
174
|
0.876
|
|
6.Income level
|
85.629
|
60
|
0.017*
|
|
7.If not employed
|
|
|
|
|
8. Filing Experience
|
|
|
|
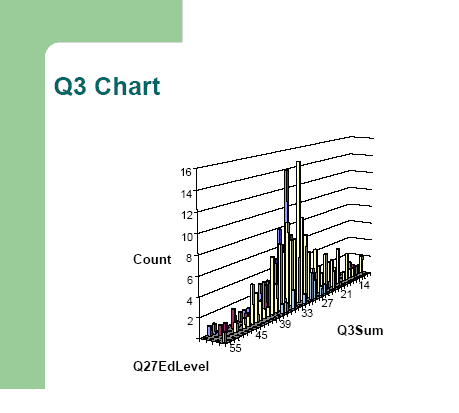
The chart indicates that for the sum of responses to Q3 there was a fairly normal distribution against level of education Q27 as depicted and in fact for all demographic variables tested Q24-29.
That is, the majority of respondents indicated, that regardless of the type of evasion by whatever occupational group, the penalties used by the ATO were about right. (ie between 39-30 on the axis which is indicated as response 4 on the Likert scale).
The other axis indicates the levels of education:
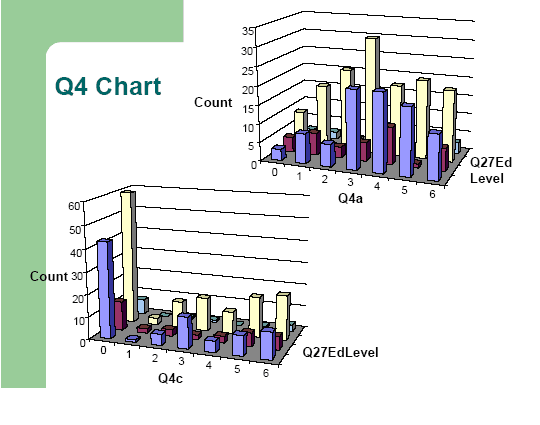
The top chart indicates the number of responses to Q4 (a) of the survey in relation to a monetary fine as the appropriate penalty for tax fraud with respect to the level of education Q 27.
Of those with a secondary level of education (blue bars) the majority indicated that a penalty in the range of $10,000- 15,000 was appropriate, with a definite skew to the right indicating heavier penalties. Those with Diploma level (red bars) were more evenly spread throughout penalty levels, while those with tertiary qualifications (yellow bars) also indicated that a heavier penalty of $10,000 or more was appropriate.
The bottom chart indicates the number of responses to Q4(c) of the survey in relation to a Community Service as the appropriate penalty for tax fraud with respect to the level of education Q 27.
Of those with a secondary level of education (blue bars) a large majority indicated a period less than one week of community service was appropriate. Those with diploma level education (red bars) were more evenly spread throughout penalty levels, although a higher proportion indicated little community service while of those with tertiary qualifications (yellow bars) a large majority indicated a period of less than one week of community service was appropriate.
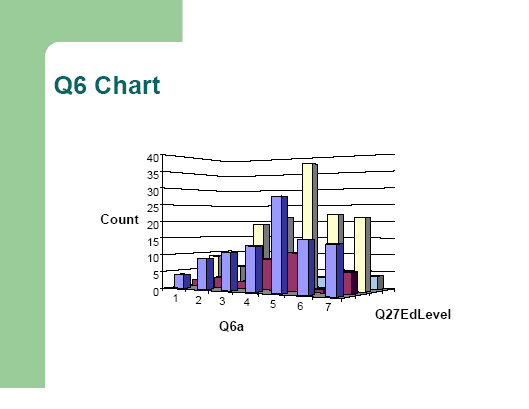
The chart indicates the number of responses to Q6(a) of the survey indicating whether respondents felt that their tax fraud was wrong, compared with their level of education Q 27
Of those with a secondary level of education (blue bars) a larger majority indicated a rating of likely to very likely. Those with Diploma level (red bars) were more neutral in this regard while of those with tertiary qualifications (yellow bars) a large majority indicated a rating of likely to very likely.
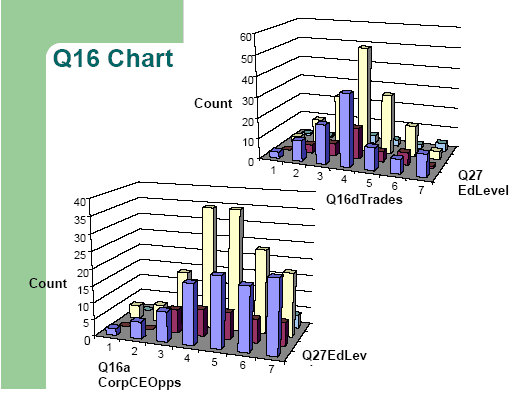
The TOP CHART indicates the number of responses to Q16 (d) of the survey in relation to the opportunities to legally reduce tax for tradespeople with respect to the level of education Q 27.
Of those with a secondary level of education (blue bars) the majority indicated that tradespeople tend to have too few opportunities to legally reduce their tax with a definite skew to the left. Those with diploma level education (red bars) showed more of a normal distribution while those with tertiary qualifications (yellow bars) also indicated that tradespeople have about the right amount of opportunities.
The BOTTOM CHART indicates the number of responses to Q16(a) of the survey in relation to the opportunities to legally reduce tax for CEOs of large Corporations with respect to the level of education Q 27.
Of those with a secondary level of education (blue bars) the majority indicated that corporate CEOs tend to have too many opportunities to legally reduce their tax with a definite skew to the right. Those with diploma level education (red bars) showed more of a normal distribution but generally felt opportunities were more while those with tertiary qualifications (yellow bars) also indicated that CEO’s have either the right amount or too many opportunities. Postgraduates (green bars) were similar in this regard.
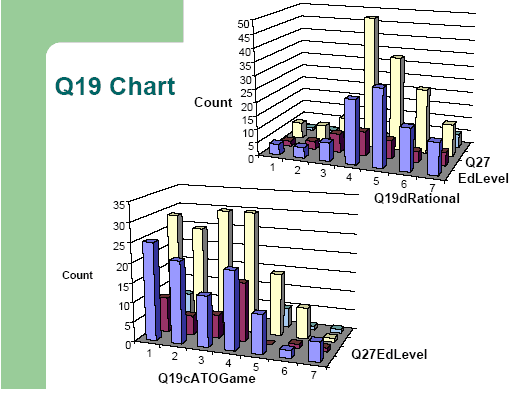
The TOP CHART indicates the number of responses to Q19 (d) of the survey in relation to the main reason for evading tax as being rationality with respect to the level of education Q 27.
Of those with a secondary level of education (blue bars) the majority indicated that that they would be indifferent or likely to agree with rationality as being a reason for evasion (skew to the right). Those with diploma level education (red bars) showed more of a normal distribution while those with tertiary qualifications (yellow bars) also indicated that they were neutral or likely to agree with rationality as being a reason for evasion (skew to the right).
The BOTTOM CHART indicates the number of responses to Q19(c) of the survey in relation to the main reason for evading tax as being a game against the ATO with respect to the level of education Q 27.
Of those with a secondary level of education (blue bars) the majority indicated that they would be indifferent or disagree to strongly disagree with an ATO game as being a reason for evasion (skew to the left). Those with diploma level education (red bars) were consistent with this pattern while those with tertiary qualifications (yellow bars) were also consistent with this pattern and disagreed with the ATO game as being a reason for evasion (skew to the left).
[∗]Ken Devos is a Senior Lecturer in Taxation Law, in the Department of Business Law and Taxation, Monash University. The author would also like to thank Dr Lee Gordon-Brown of the Department of Econometrics for his assistance with the statistical analysis.
[1] Worsham, R. G., “The Effect of Tax Authority Behaviour on Tax Compliance: A Procedural Justice Approach,” Journal of the American Taxation Association, Vol 18, No 2, Spring, (1996): 19-39.
[2] Stratton, S., ‘Taxpayer Advocate addresses disclosure, withholding,’ (2004 February 9) Tax Notes,714.
[3]Roth, J. A., Scholz, J. T. and Witte, A. D., (eds), Taxpayer Compliance an Agenda for Research,” Vol 1, Philadelphia PA: University of Pennsylvania Press, (1989), 21. See also Jackson, B. R. and Milliron, V. C., “Tax Compliance Research: Findings Problems and Prospects,” (1986), Vol 5, Journal of Accounting Literature, 125 – 165; Richardson, M. and Sawyer, A. J., “A Taxonomy of the Tax Compliance Literature: Further Findings, Problems and Prospects,” (2001), Vol 16, Australian Tax Forum, 137-320 and Tan, L. M. and Sawyer, A. J., “A Synopsis of Taxpayer Compliance Studies – Overview Vis-à-Vis New Zealand,” (2003), Vol 9,:4 New Zealand Journal of Taxation Law and Policy, 431-454.
[4]James, S. and Alley, C., “Tax Compliance, Self Assessment and Tax Administration in New Zealand- Is the Carrot or Stick More Appropriate to Encourage Compliance,?” (1999), Vol 5:1 New Zealand Journal of Taxation Law and Policy, 3-14, at 11.
[5] Freiberg, A., “Enforcement Discretion and Taxation Offences,” (1986), 3 Australian Tax Forum, 55, 59.
[6](Lord Keith of Kinkel Committee on Enforcement Powers of the Revenue Departments, Report 2, Vols 1 and 2.
(London: HMSO, 1983, Cmnd 8822) Vol 1, 9.
[7] Articulated by the Committee on Enforcement Powers of the Revenue Departments, (London: HMSO, 1983, Cmnd 8822) Report 2, 9 (1983).
[8] Ibid.
[9] Freiberg, A., above n 5.
[10] Tomasic, R. & Pentony, B., (1990) Defining Acceptable Tax Conduct, Discussion Paper (No 2), Centre for National Corporate Law Research, University of Canberra, 1.
[11] Ibid 3.
[12] Milliron, V. C., and Toy, .D.R., “Tax Compliance an Investigation of Key Features,” (1988), Vol 10, Journal of American Taxation Association, 84-104, 85.
[13]Fischer, C. M., Wartick, M. and Mark, M.M., “Detection Probability and Taxpayer Compliance: A Review of the Literature,” (1992), Vol 11, Journal of Accounting Literature, 1-46, 2.
[14] Allingham, M. G. and Sandmo, A., “Income Tax Evasion: A Theoretical Analysis,” (1972), Vol 1, Journal of Public Economics, 323-338.
[15] Tittle, C. and Logan, C., “Sanctions and Deviance; Evidence and Remaining Questions,” Law and Society Review, (Spring) (1973), 371-389.
[16] Friedland, N., “A Note on Tax Evasion as a Function of the Quality of Information about the Magnitude and Creditability of Threatened Fines: Some Preliminary Research,” Journal of Applied Social Psychology, February, (1982), 54-59.
[17] Jackson, B. and Jones, S., “Salience of Tax Evasion Penalties Versus Detection Risk,” Journal of the American Taxation Association (Spring), (1985) 7-17. This research also added credence to congressional efforts to raise the magnitude of legal penalties a taxpayer faces for non-compliance. Code Section 6661.
[18] In a self-assessment environment tax returns are accepted on face value and then subject to potential audit.
[19] Witte, A. & Woodbury, D., “The effect of Tax Laws and Tax Administration on Tax Compliance,” Working paper 83-100, Department of Economics, University of North Carolina, Chapel Hill, North Carolina, USA (1983).
[20]Schwartz, R. & Orleans, S., “On Legal Sanctions,” University of Chicago Law Review (Winter), (1967), 274-300.
[21] Allingham, M. G. and Sandmo, A. above n 14.
[22]Jackson, B. R, & Milliron, V. C., “Tax Compliance Research: Findings, Problems, and Prospects,” Journal of Accounting Literature Vol 5, 1986, 125-165, 142.
[23] Carnes, G. A., & Eglebrecht, T. D., “An investigation of the Effect of Detection Risk Perceptions, Penalty Sanctions and Income Visibility on Tax Compliance,” Journal of the American Taxation Association, 17 Spring, (1995), 26-41.
[24] Falkinger, J. & Walther, H., “Rewards verus Penalties: on a New Policy on Tax Evasion,” Public Finance Quarterly, 19, (1991), 67-79.
[25]Roth, J. A. & Scholz, J. T., and Witte, A. D., (eds), “Taxpayer Compliance Volume 1: An Agenda for Research,” Philadelphia: University of Pennsylvania Press, (1989); also see n 3 above.
[26] Hasseldine, J., “Linkages between Compliance Costs and Taxpayer Compliance,” 54, Bulletin for International Fiscal Documentation, (2000), 299-303.
[27] Ajzen, I., and Fishbein, M., Understanding Attitudes and Predicting Social Behaviour, Englewood Cliffs, Prentice Hall, (1980).
[28] Cialdini, R. B., “Social Motivations to Comply: Norms, Values and Principles,” in Roth, J. A., Scholz, J. T., and Witte, A. D. (eds), Taxpayer Compliance Social Science Perspectives, (1989) Vol 2, Philadelphia, PA: University of Pennsylvania Press: 200-227.
[29] Schmolders, G., “Fiscal Psychology: A New Branch of Public Finance,” (1959), Vol 12, National Tax Journal, 340-345.
[30] Hite, P., A., “Identifying and Mitigating Taxpayer Non-Compliance,” (1997) Vol 13, Australian Tax Forum, 155-180.
[31] Ibid 161.
[32] Tan, L. M., “Taxpayers Perceptions of the Fairness of the Tax System – A Preliminary Study,” (1998) Vol 4, New Zealand Journal of Taxation Law and Policy, 59-71, 60.
[33] Ibid 61.
[34] The citizen as having a responsible attitude to paying their share of taxes.
[35] Meier, R.F, and Johnson, W. T, “Deterrence as a Social Control: The Legal and Extralegal Production of Conformity,” (1977) Vol 42 ,American Sociological Review, 292-304.
[36] Jackson, B. R, & Milliron, V. C., above n 22.
[37] Alm, J. Sanchez, I. and De Juan, A., “Economic and Non-Economic Factors in Tax Compliance,” (1995) Vol 48, Kyklos, 3-18.
[38] Pilkington, C., “Taxation and Ethical Issues,” in Growthorpe, C., and Blake, J., (eds), Ethical Issues in Accounting, (1998), London, Routledge.
[39] Kinsey, K. A., Theories and Models of Tax Cheating, American Bar Foundation, Working Paper No 8717, (1988).
[40] Richardson, M. and Sawyer, A. J., “A Taxonomy of the Tax Compliance Literature: Further Findings Problems and Prospects,” (2001) Vol 16, Australian Tax Forum, 137-320, at 149. See also Jackson and Milliron, n 22 above.
[41] No doubt there is a range of economic considerations from the government’s point of view as to whether to increase penalties and sanctions for tax offences. This is particularly so when the cost of auditing and collecting the taxes outweighs the additional revenue that will be raised.
[42] Dean, P. et al, “Taxpayers Attitudes to Income Tax Evasion: An Empirical Study,” (1980) British Tax Review, Vol 28, 112-131.
[43] Jackson, B. R, & Milliron, V. C, above, n 22.
[44] Lewis, A., The Psychology of Taxation, (1982) Martin Robertson, Oxford, 127.
[45] Schwartz, R. & Orleans, S., above n 20.
[46] Witte, A., & Woodbury, D., above n 19.
[47] Wallschutzky, I. G., “Possible causes of Tax Evasion,” Journal of Economic Psychology, (1984), Vol 5, No 4, 371-384.
[48] Wallschutzky, I. G., “Taxpayer Attitudes to Tax Avoidance and Evasion,” Australian Tax Research Foundation, Research Study No 1, (1985).
[49] Ibid 43.
[50] McKerchar, M., “The Impact of Complexity Upon Tax Compliance: A Study of Australian Personal Taxpayers,” Australian Tax Research Foundation, Research Study No 39, (2003).
[51] Ibid 207, See also Long, S. and Swingen, J., “The Role of Legal Complexity in shaping Taxpayer Compliance in Van Koppen, P Hessing, D and G. Van der Heuvel, (Eds), Lawyers on Psychology and Psychologists on Law, Swets & Zeitlinger, Lisse, pp127-145.
[52] Gilligan, G. and Richardson, G., “Perceptions of Tax Fairness and Tax Compliance in Australia and Hong Kong- A Preliminary Study,” Journal of Financial Crime, Vol 12, No 4, 2005, 1-13.
[53] Coleman, C. and Wilkins M., in Walpole, M. and Evans, C., Chapter 22, Tax Administration in the 21st Century, Prospect, Sydney, 2001, 263-264.
[54] Niemirowski, P. Baldwin, S., and Wearing, A., in Walpole, M. and Evans, C., Chapter 18, Tax Administration in the 21st Century, Prospect, Sydney, 2001, 211.
[55] Richardson, M. and Sawyer, A. J., above n 40 and Jackson, B. R., and Milliron, V. C., above n 22.
[56] Oxley, P., “Women and Paying Tax,” (1993) in C., Scott, (Ed) Women and Taxation, Wellington Institute of Policy Studies, 31.
[57] For example, Robben et al [1989] found no significant relationship between gender and compliance, but their experiment involved only 22 females and twice as many males.
[58] Hite, P. A., above n 30, 155.
[59] For example, Beron, K. J., Tuachen H., V., and Witte, A. D., [1992] found the age was positively related to compliance for low and middle income proprietors, whereas Dubin and Wilde [1986] found a similar effect only for low and high income non-business taxpayers, below n 63.
[60] See for example, Smith, K., W., “Reciprocity and Fairness: Positive Incentives for Tax Compliance,” in Slemrod, J., (ed), Why People Pay Taxes: Tax Compliance and Enforcement, (1992) Ann Arbour, MI, University of Michigan Press, 223.
[61] See for example, Porcano, T. M., “Correlates of Tax Evasion,” (1988), Journal of Economic Psychology, 47.
[62] Roth, J. A., and Scholz, J. T., and Witte, A D., above n 25.
[63] Beron, K. J., Tauchen, H., V. and Wittie, A., D., “The Effect of Audits and Socioeconomic Variables on Tax Compliance,” in Slemrod, J. (Ed), Why People Pay Taxes: Tax Compliance and Enforcement, (1992) Ann Arbour, MI, University of Michigan Press, 67.
[64] See for example Song, Y., and Yarborough, T., “Tax Ethics and Taxpayer Attitudes: A Survey,” (1978), Public Administration Review, 442.
[65] See for example, Wallschutzky [1993] who indicated that education is the variable most likely to improve compliance, whereas Beron, Tauchen and Witte [1992] indicated that inconsistent results are produced as education is highly correlated with income level.
[66] See for example, Jackson, B. R, & Milliron, V. C, “Tax Compliance Research: Findings, Problems, and Prospects,” Journal of Accounting Literature, Vol 5, 1986, pp125-165 and Richardson, M. and Sawyer, A. J., “A Taxonomy of the Tax Compliance Literature: Further Findings Problems and Prospects,” (2001), Vol 16, Australian Tax Forum, 137-320, at 149 and Lewis, A., The Psychology of Taxation, (1982), Martin Robertson, Oxford, 127.
[67] Hite, P. A., above n 30, 155.
[68] Beron, K. J, Tauchen, H. V., and Wittie A. D., above n 59, 67.
[69] Mc Graw, L. K., and Scholz, J., T., “Norms, Social Commitment and Citizens Adaption to New Laws,” in Van Koppe, P. J., Hessing, D. and Van den Heuvel, G. (eds), Lawyers on Psychology and Psychologists on Law, Amsterdam the Netherlands, Sweets and Zeitlinger, (1988), 105.
[70] Roberts, M. L., “An Experimental Approach to Changing Taxpayers Attitudes,’ Towards Fairness and Compliance via Television,” (1994), Journal of the American Taxation Association, Vol 16, 67.
[71]Smith, K.W., “Reciprocity and Fairness: Positive Incentives for Tax Compliance,” (1992), in Slemrod, J. (ed) Why People Pay Taxes, Tax Compliance and Enforcement, Ann Arbour MI, University of Michigan Press, 223.
[72] Grasmick, H. G., Bursik, R. J., “Conscience, Significant Others and Rational Choice: Extending the Deterrence Model,” (1990), Vol 24, Law and Society Review, 837.
[73] See For Example, Fallan, L., “Gender Exposure to Tax Knowledge, and Attitudes towards Taxation: An Experimental Approach” (1999), Vol 18, Journal of Business Ethics, 173 and Erskin, K. and Fallen, L., “Tax Knowledge and attitudes Towards Taxation: A Report on a Quasi-Experiment,” (1996) Journal of Economic Psychology, 387. Both Studies found that improved tax knowledge increases students’ attitudes towards the fairness of the tax system, such that they consider the tax system to be fairer. It also makes their attitude towards other peoples’ tax evasion stricter.
[74]See for example, Parcano [1988] above n 61 and Beron, Tuachen and Witte [1992] above n 63.
[75] See for example, Mason, R. and Calvin, L., “A Study of Admitted Income Tax Evasion,” (1978) Law Society and Review, Vol 12, 73. The author’s occupational categories were, professional/technical, managers and officials (not-self employed) managers and officials (self employed), clerical and sales, craftsman, operators and unskilled.
[76] Hasseldine, D. J., Kaplan, S.E., and Fuller, L. R., “Characteristics of New Zealand Tax Evaders: A Note” (1994), Vol 34, Accounting and Finance, 79. Hasseldine’s survey only included two categories- self-employed/sales/professional and clerical/administration/manual.
[77] Robben, H. S .J., Hessing, .D. J, and Elffers, H., “Legal Controls and Type of Employment in Tax Evasion Behaviour,” in Lea, s. E.G., Webley, P. and Young, B. M, (eds), Applied Economic Psychology in the 1990’s, Vol 1, Exeter, UK, Washington Singer Press, (1990), 512.
[78] Jackson, B. R, & Milliron, V. C, above, n 22.
[79] See for example, Christian and Gupta [1993] and Hite [1997].
[80] Smith, K. W., above n 71.
[81] Baldry, J. C., “Tax Evasion is not a Gamble: A Report on Two Experiments,” (1986), Vol 22, Economic Letters, 333.
[82] Worsham, R. G, above, n 1.
[83] See for example, Feinstein, J .S., “An Econometric Analysis of Income Tax Evasion and its Detection”, RAND Journal of Economics, [1991] 22, 14-35.
[84] Tan, L. M., above n 32.
[85] Some of the questions in the survey were adopted from the study undertaken by Murphy, K (2003) into tax scheme investors at the ANU through the CTSI unit.
[86] See McIntosh and Veal achieved a 50% response rate, Tan 58% in a mail out survey, Oxley 29% and Hasseldine 22%.
[87] Cooper. D. R., Schindler, P.S., Business Research Methods, (2003), 8th Edition, Boston, Irwin/McGraw-Hill, 537.
[88] Birch A., Peters, P. and Sawyer, A., “New Zealanders Attitudes to Tax Evasion: A Demographic Analysis,” (2003), New Zealand Journal of Taxation Law and Policy, Vol 9, 65-109.
[89] Hite, P. A., above n 30.
[90] Karlinsky, K. Burton, H. and Blanthorn, C., “Perceptions of Tax Evasion as a Crime,” (2004), e-journal of Tax Research, Vol 2, No 2, 226-240.
[91] Mason, R. and Calvin, L., above n 75.
[92] James, S. and Alley, C., above n 4.
[93] Tan, L. M., above n 32.
[94] McKerchar, M., above n 50.
[95] Birch, A., Peters, T. and Sawyer A. J., above n 88.
[96] Hite, P. A., above n 30.
[97] Meier, R.F, and Johnson, W. T., above n 36.
[98] Tan, L. M, above n 32.
[99] Mason, R. and Calvin, L., above n 75.
[100] The aim of the Tax Compliance Program was to improve the overall level of tax compliance. For instance in the 2003-04 income tax year the ATO employed about 5,460 staff in preventing, detecting and deterring non-compliant behaviour- See The ATO Annual Report 2003-04, 127.
AustLII:
Copyright Policy
|
Disclaimers
|
Privacy Policy
|
Feedback
URL: http://www.austlii.edu.au/au/journals/eJlTaxR/2005/11.html